


Torontonians today are connected to fewer close friends and family than they were in 2018. Fewer than one in two Torontonians see their close relatives or friends in person at least once a week. Those with smaller social networks are significantly more likely to report poor physical and mental health; low life satisfaction; and regular feelings of anxiety, depression and loneliness.

Torontonians are connected to fewer close friends and family
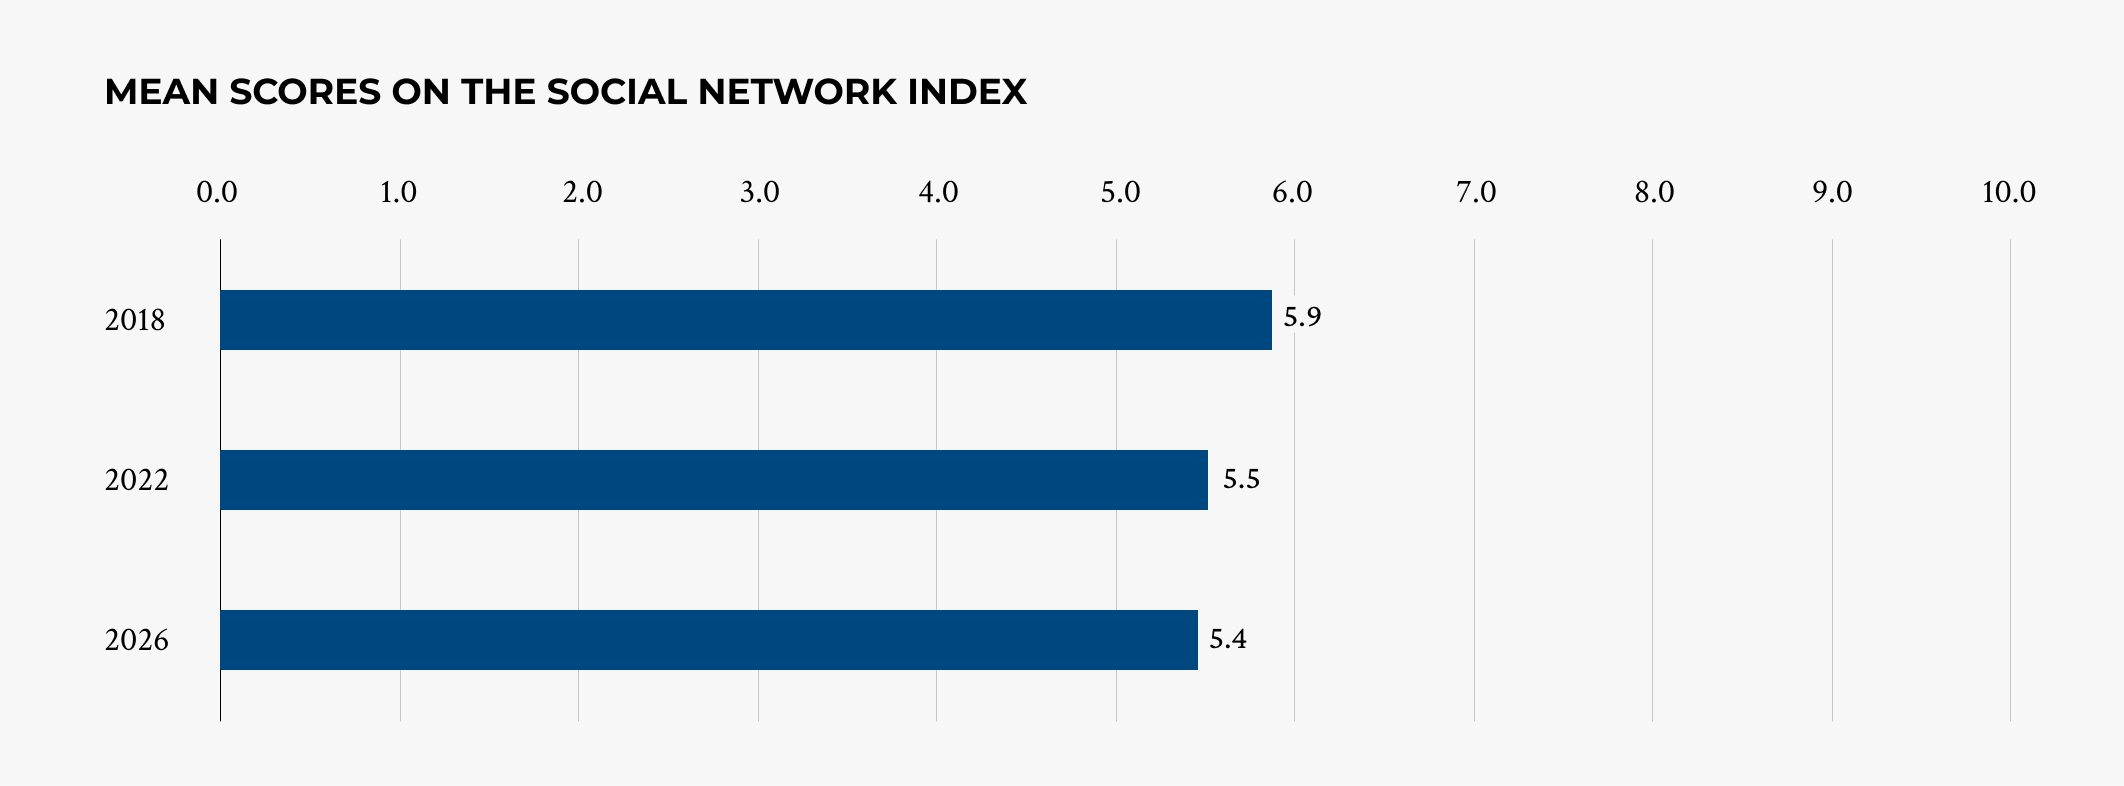
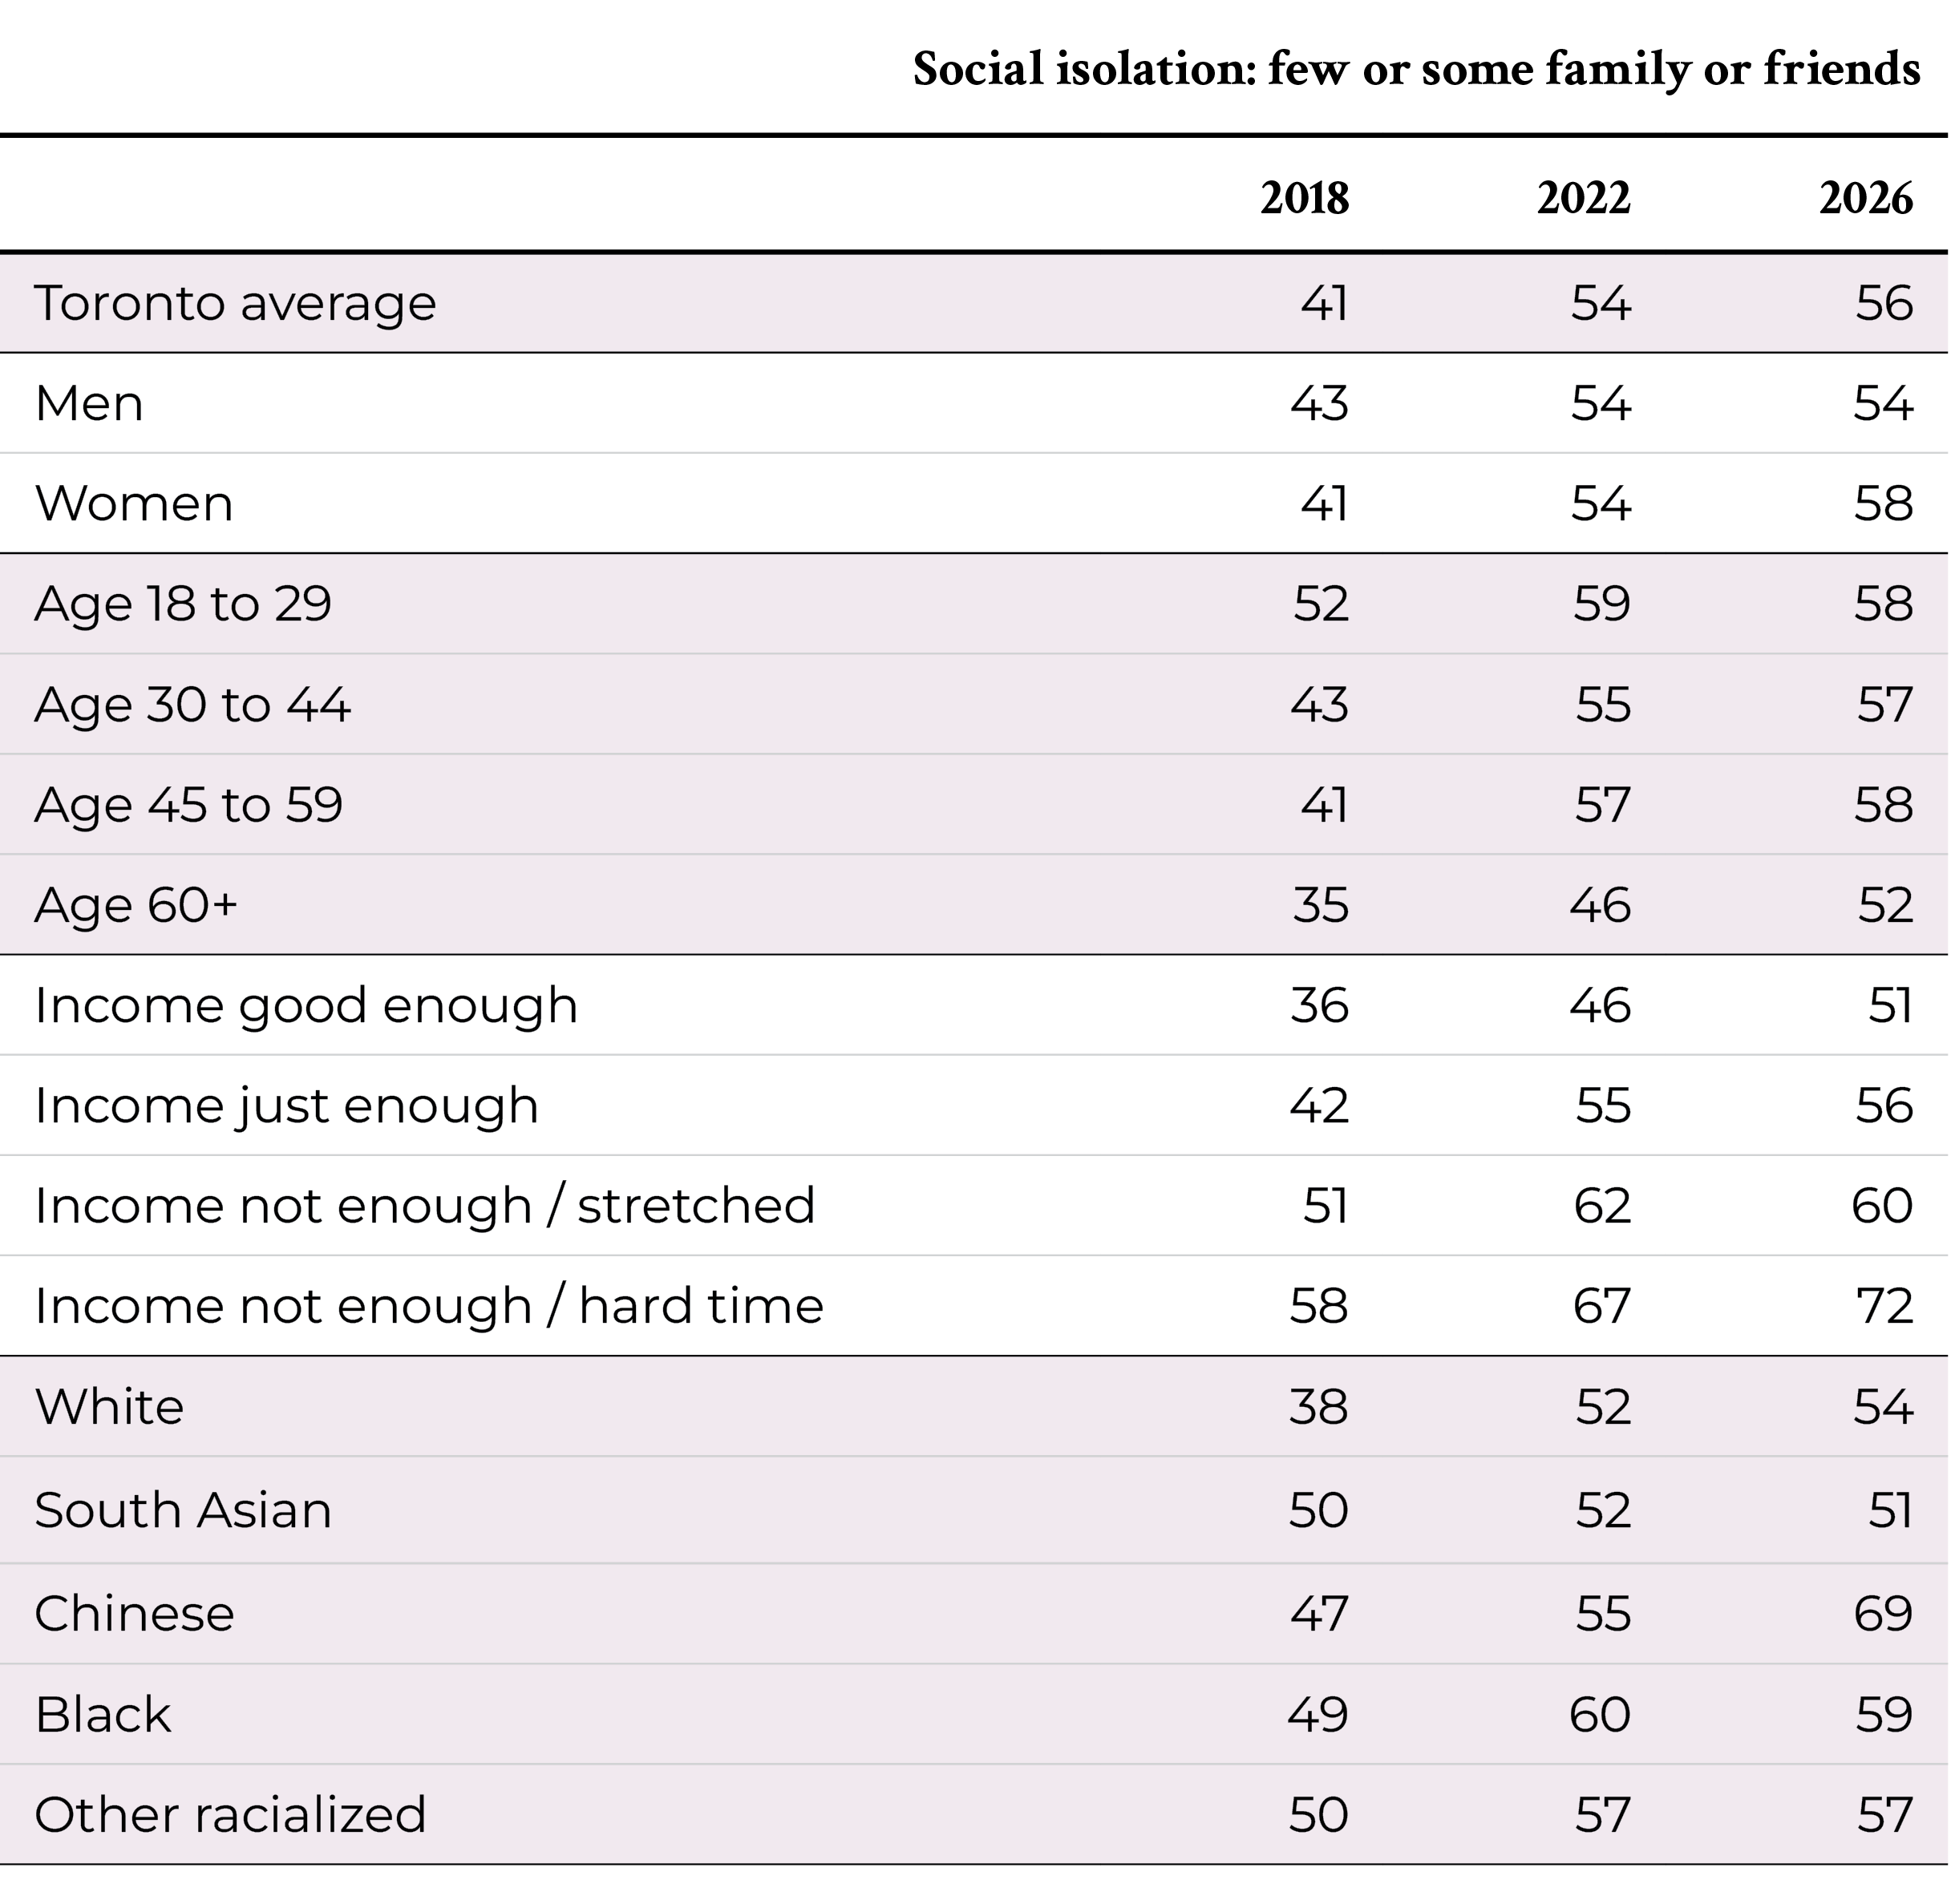
- Compared to 2018, social networks in the city are smaller. A greater proportion of Torontonians have only a few or some close relatives or friends—that is people who they feel at ease with, can talk to about what is on their mind, or call on for help.
- In 2026, 12% of city residents have no close relatives, no close friends or both. This represents almost 325,000 adults in the city.
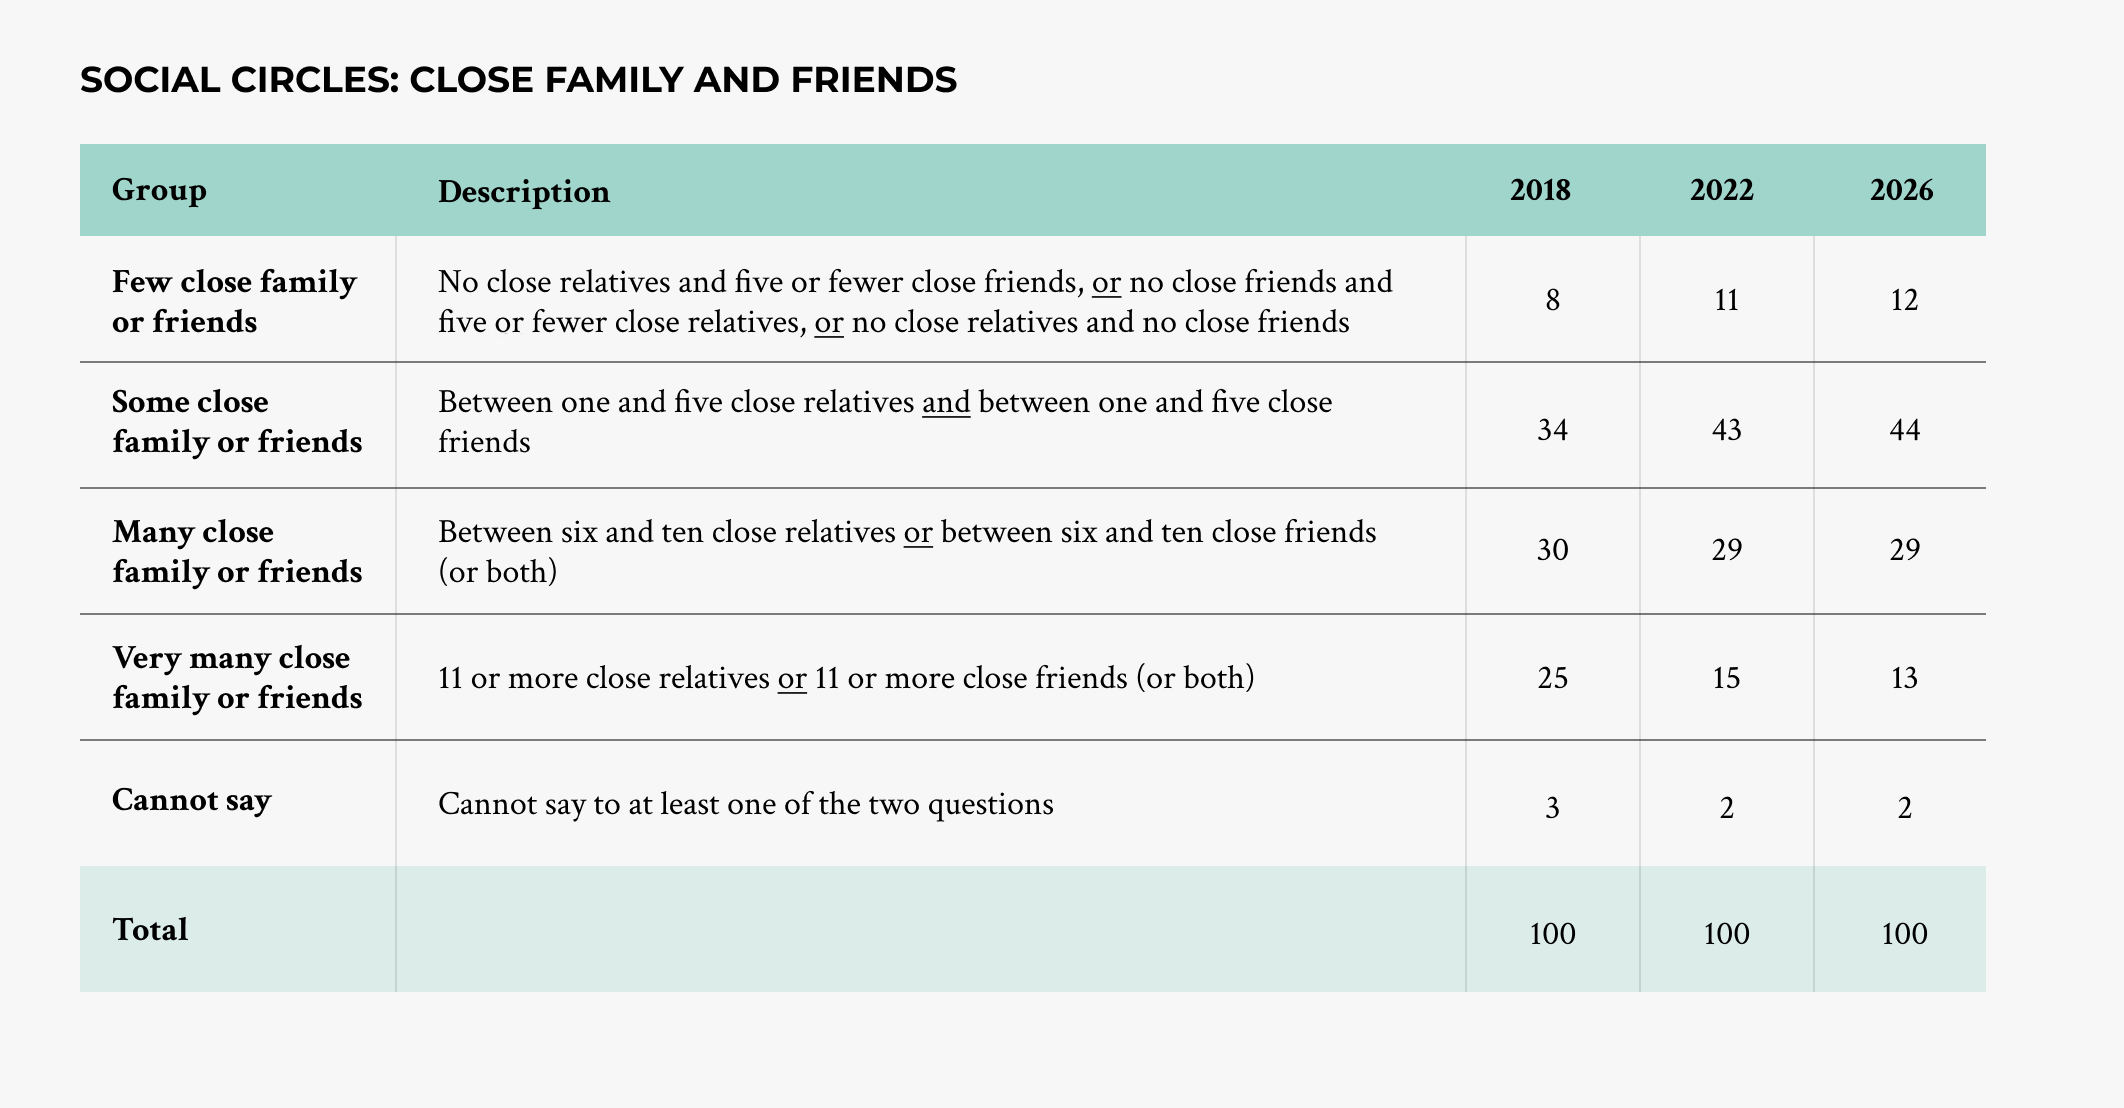
- Having only a few close relatives and friends is more common among those who have low incomes, are unemployed, have poor physical health or mental health, or who have a disability.
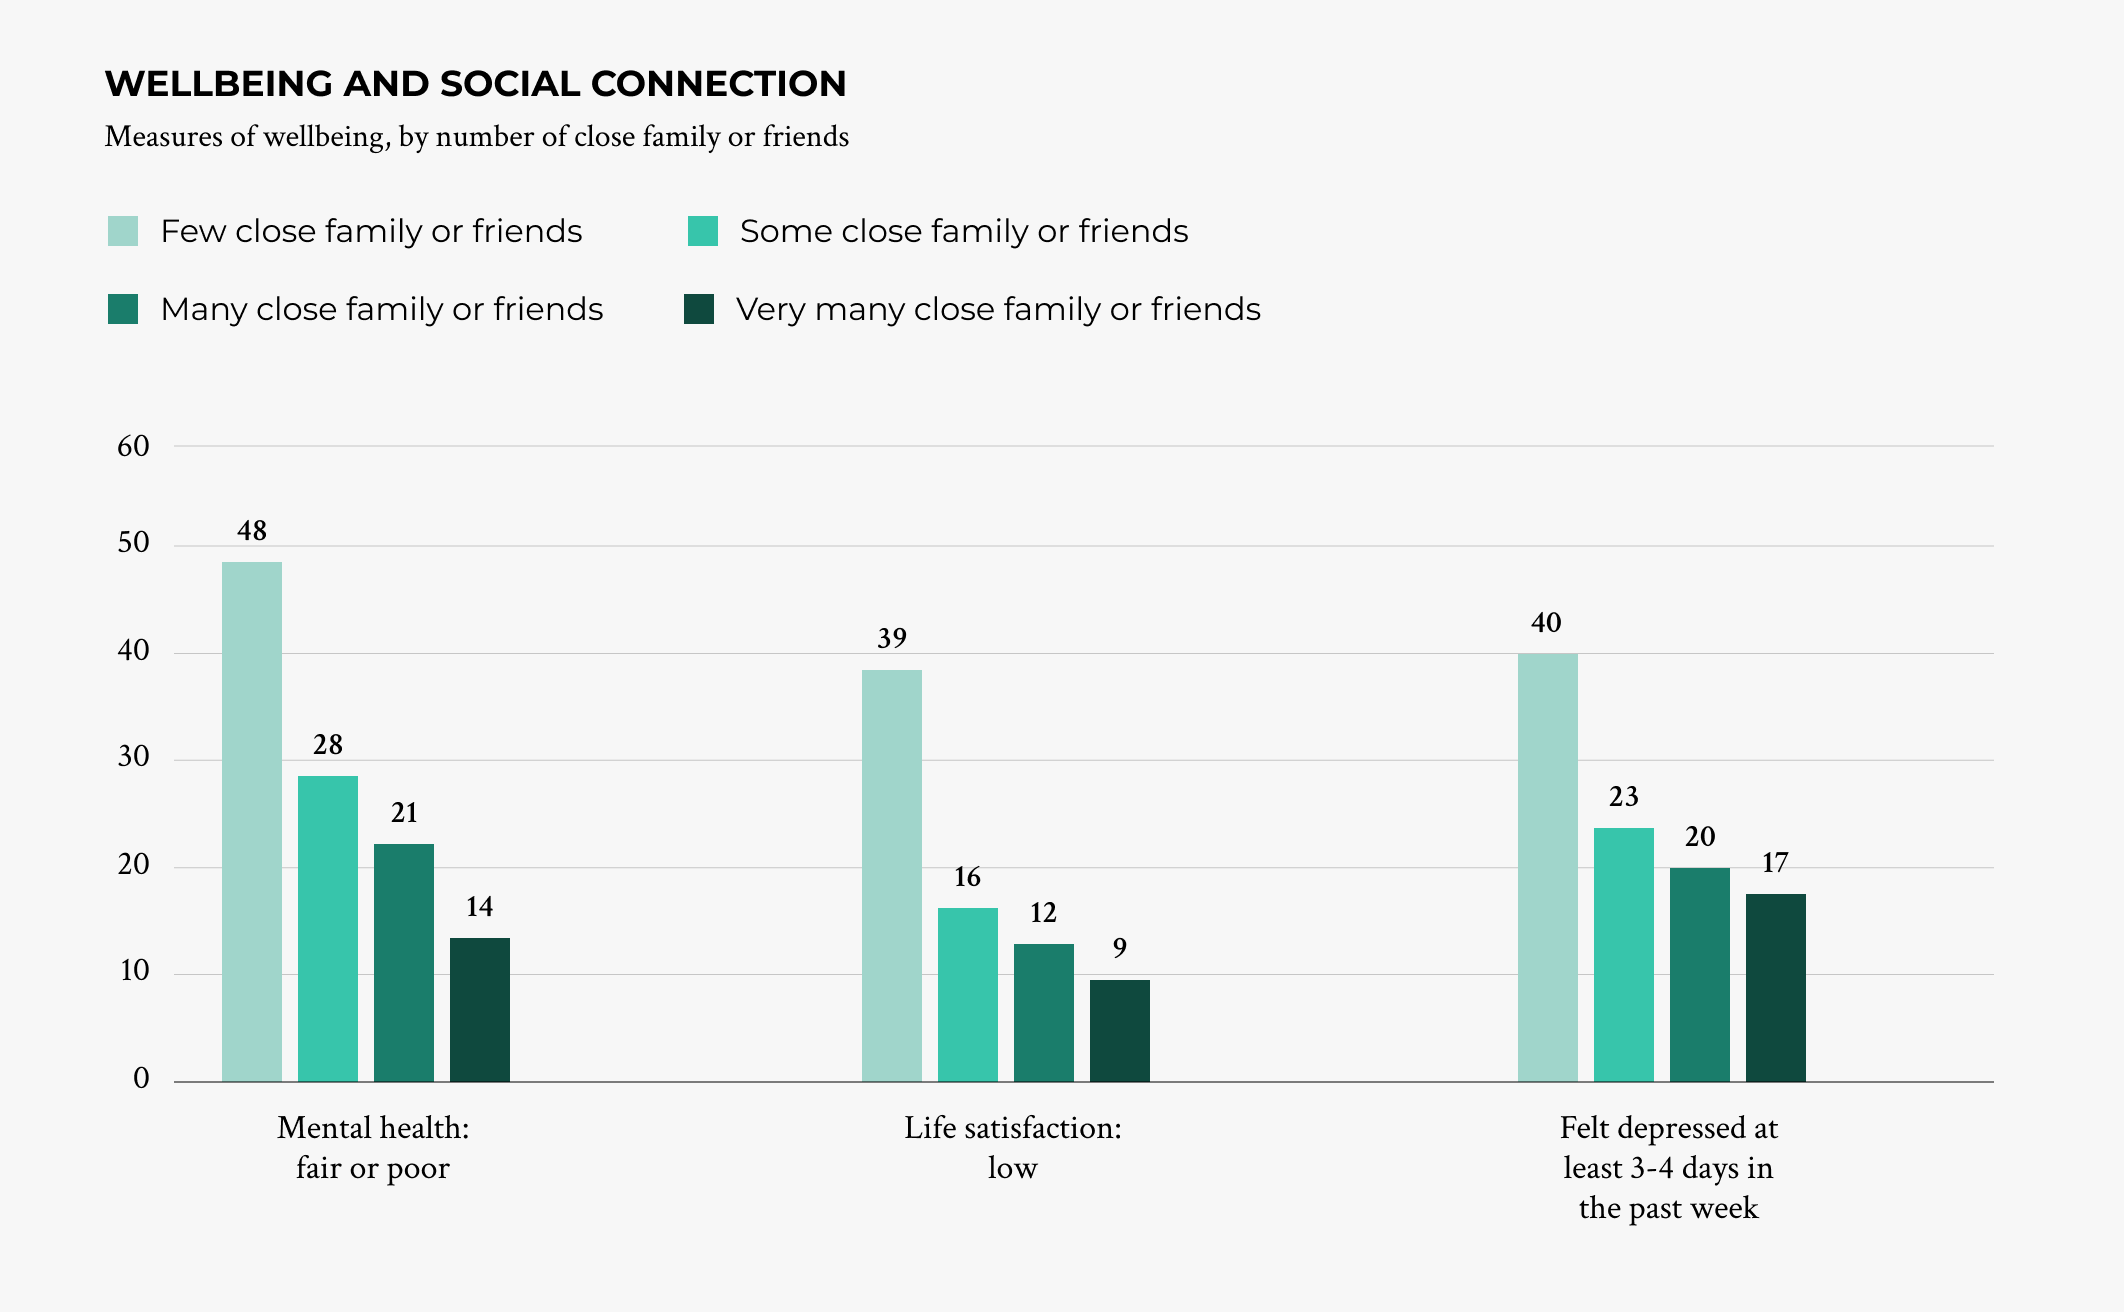
- At the same time, Torontonians with only few close relatives and friends are significantly more likely than those with larger social circles to report poor physical and mental health; low life satisfaction; and regular feelings of anxiety, depression and loneliness.
Fewer than one in two Torontonians see their close relatives or friends in person at least once a week
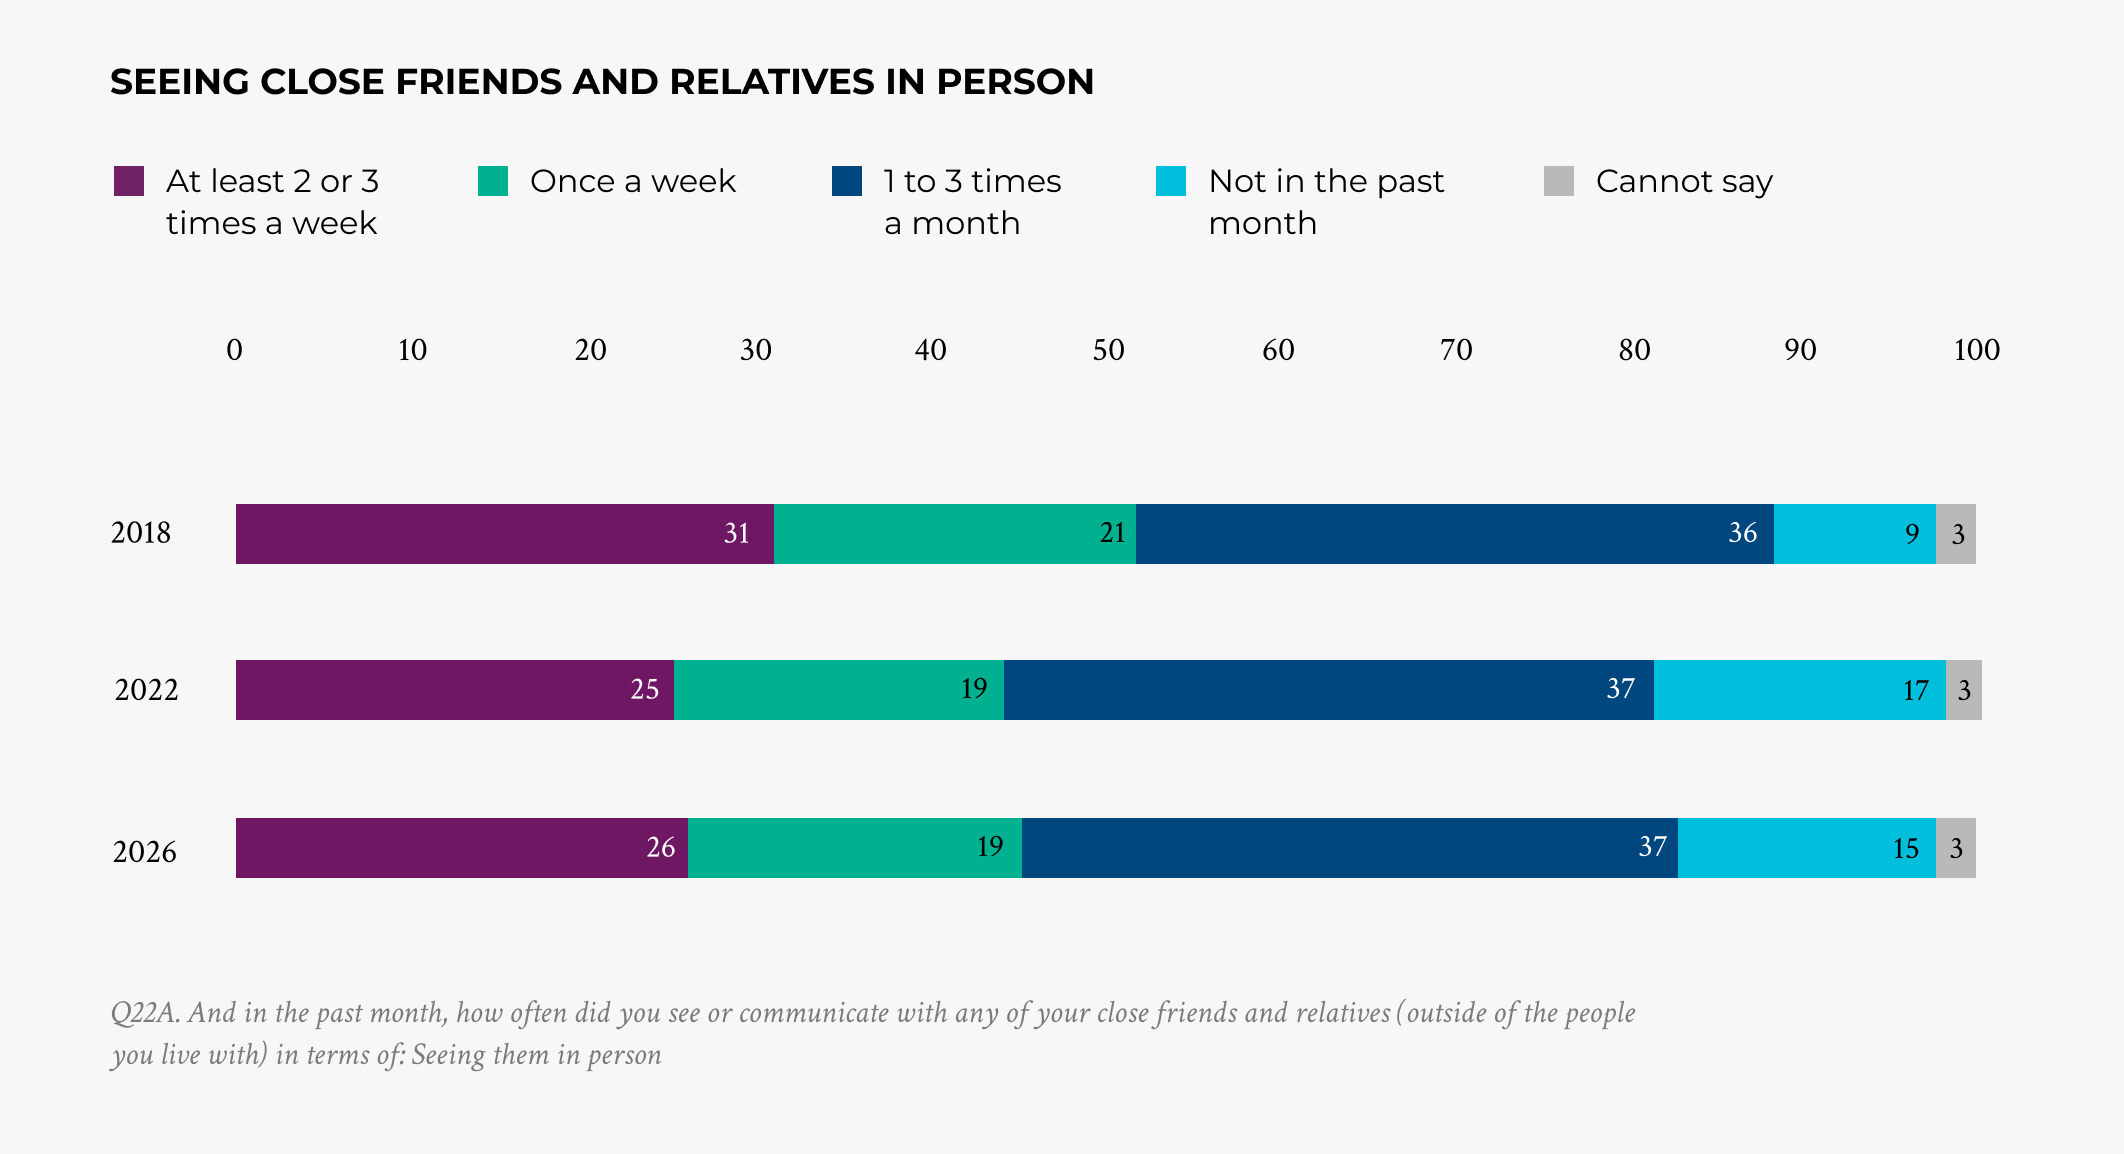
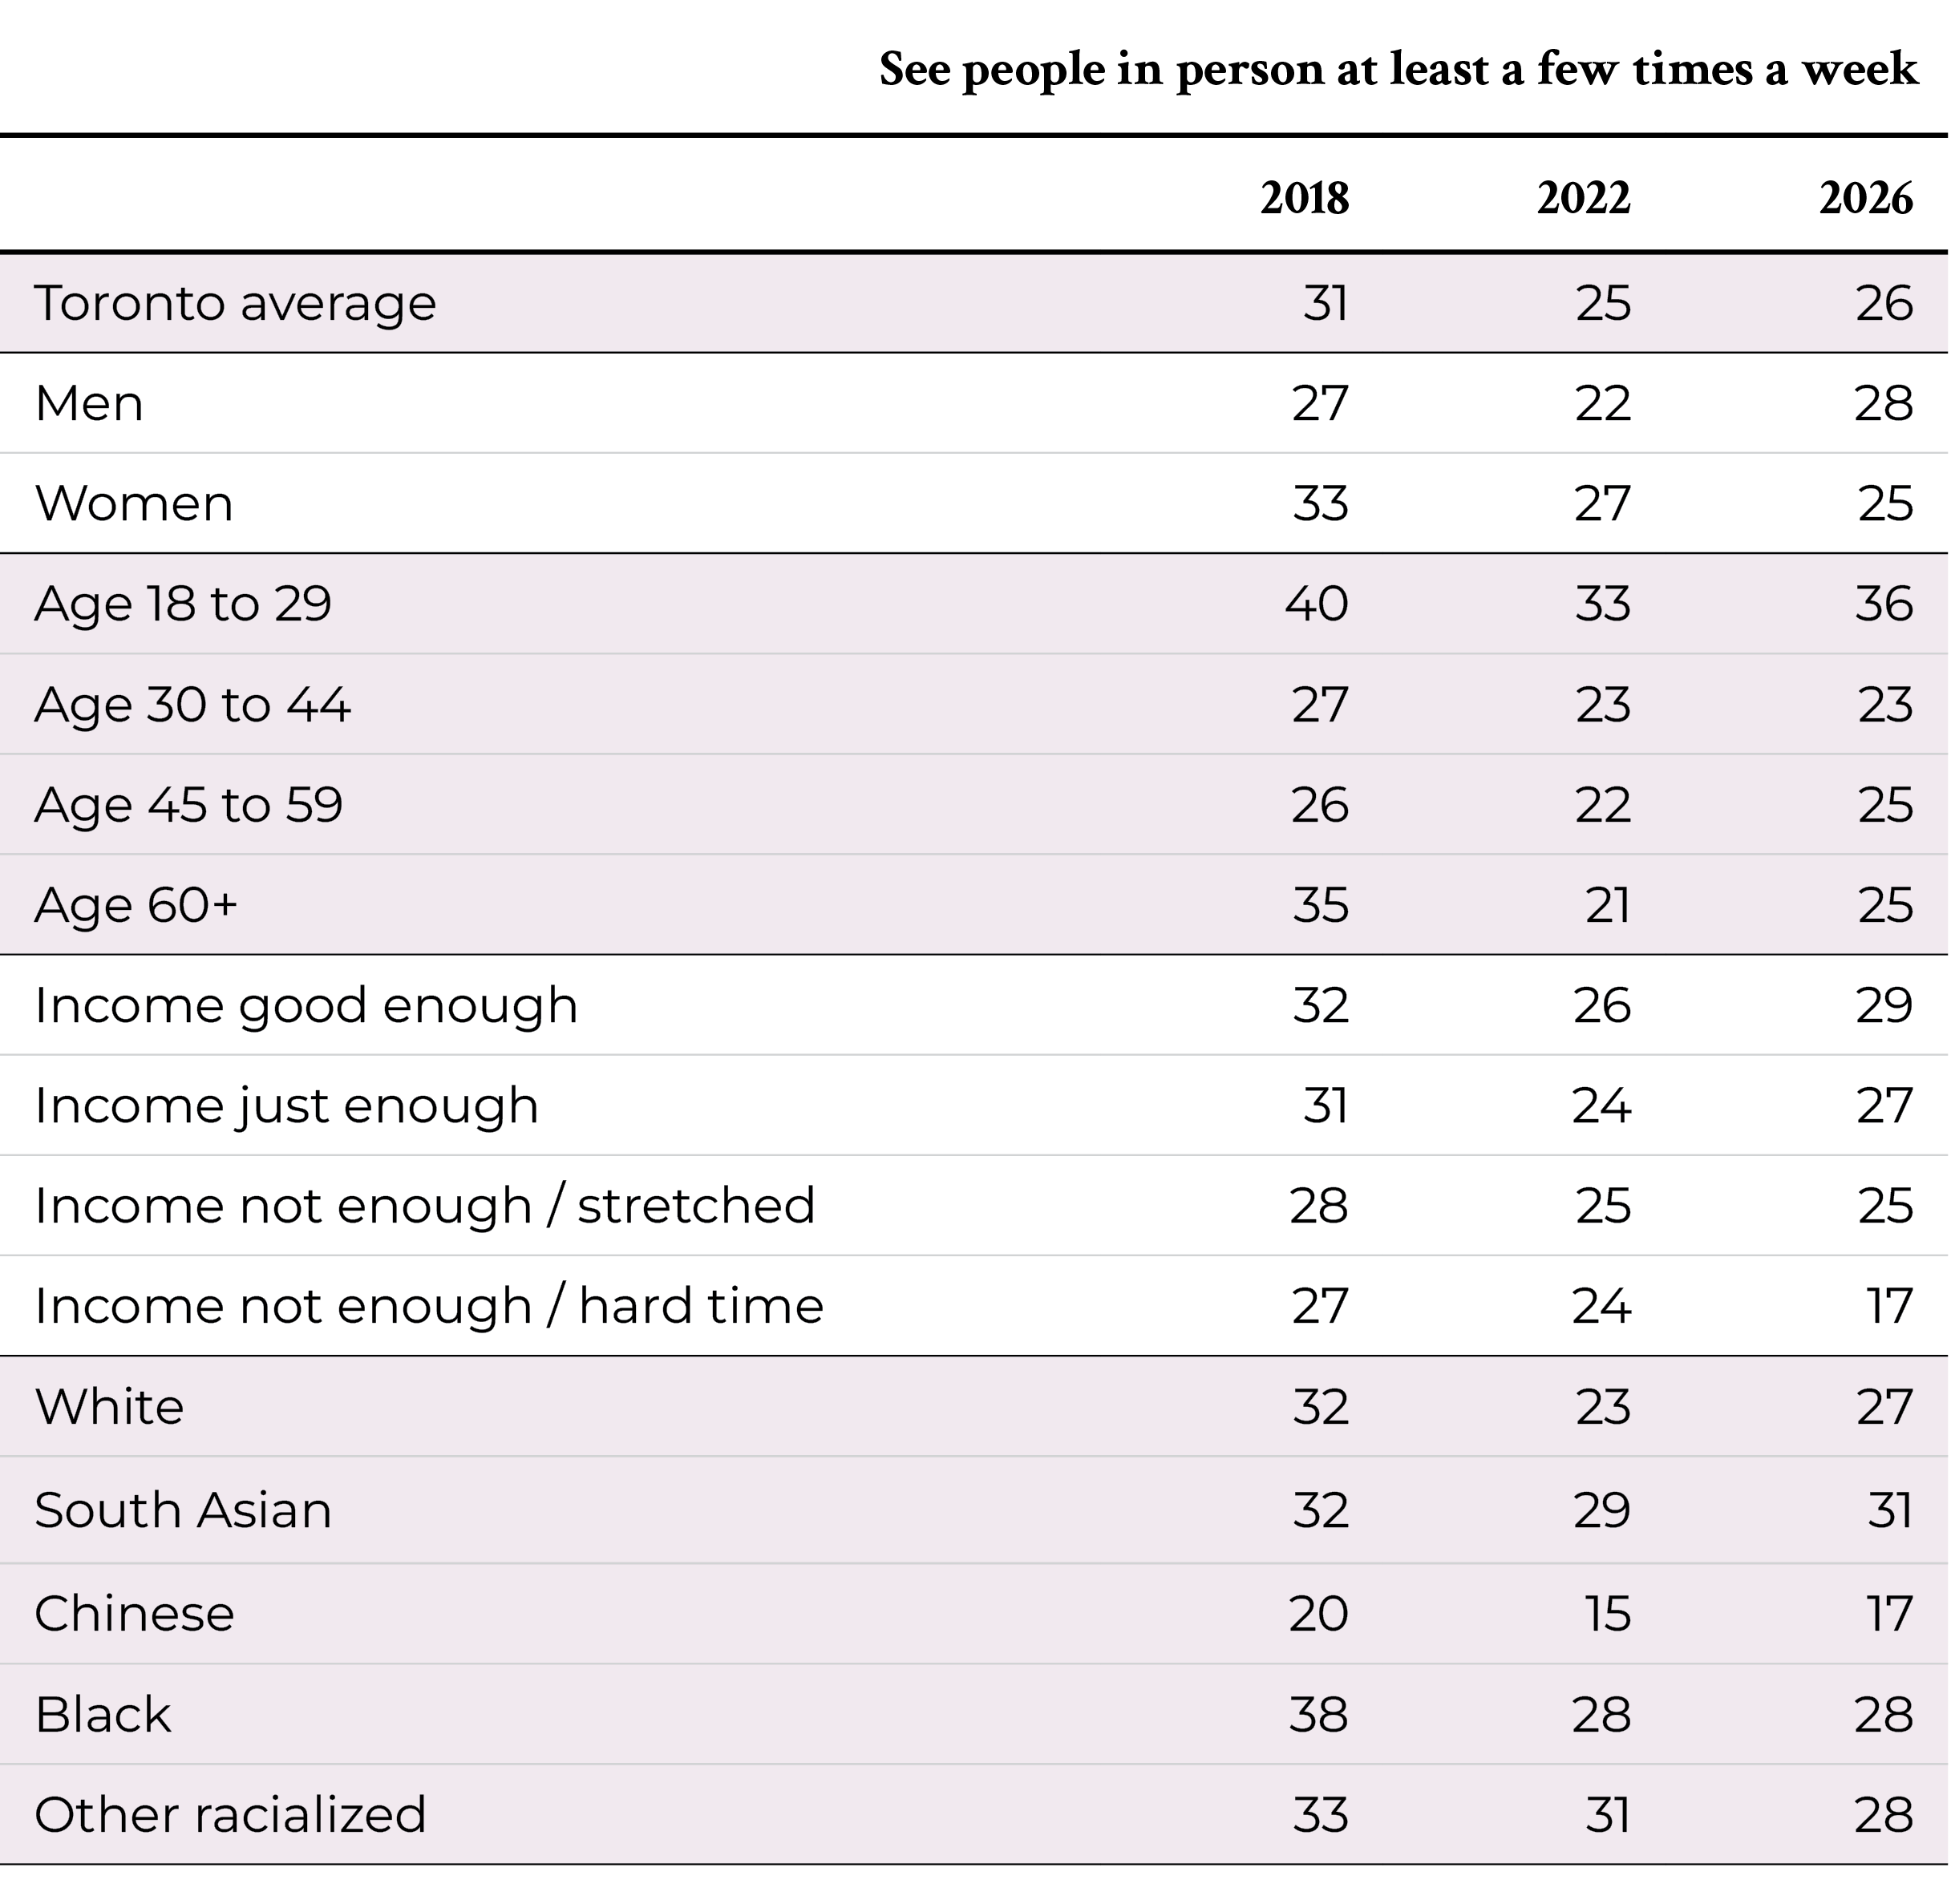
- 45% of Torontonians see their close relatives or friends in person at least once a week. This is down from 52% in 2018.
- The drop in this frequency of in-person contact with close relatives or friends is higher for residents age 60 and older (down from 35% to 25%), those who are having a hard time because of low income (27% to 17%) and those who identify as Black (38% to 28%).
- Torontonians are more likely to be in communication with close relatives or friends at least once a week by telephone (53%), or by email or text (70%). But, while the frequency of in-person communication has declined, the frequency of these other forms of communication has not increased to compensate.
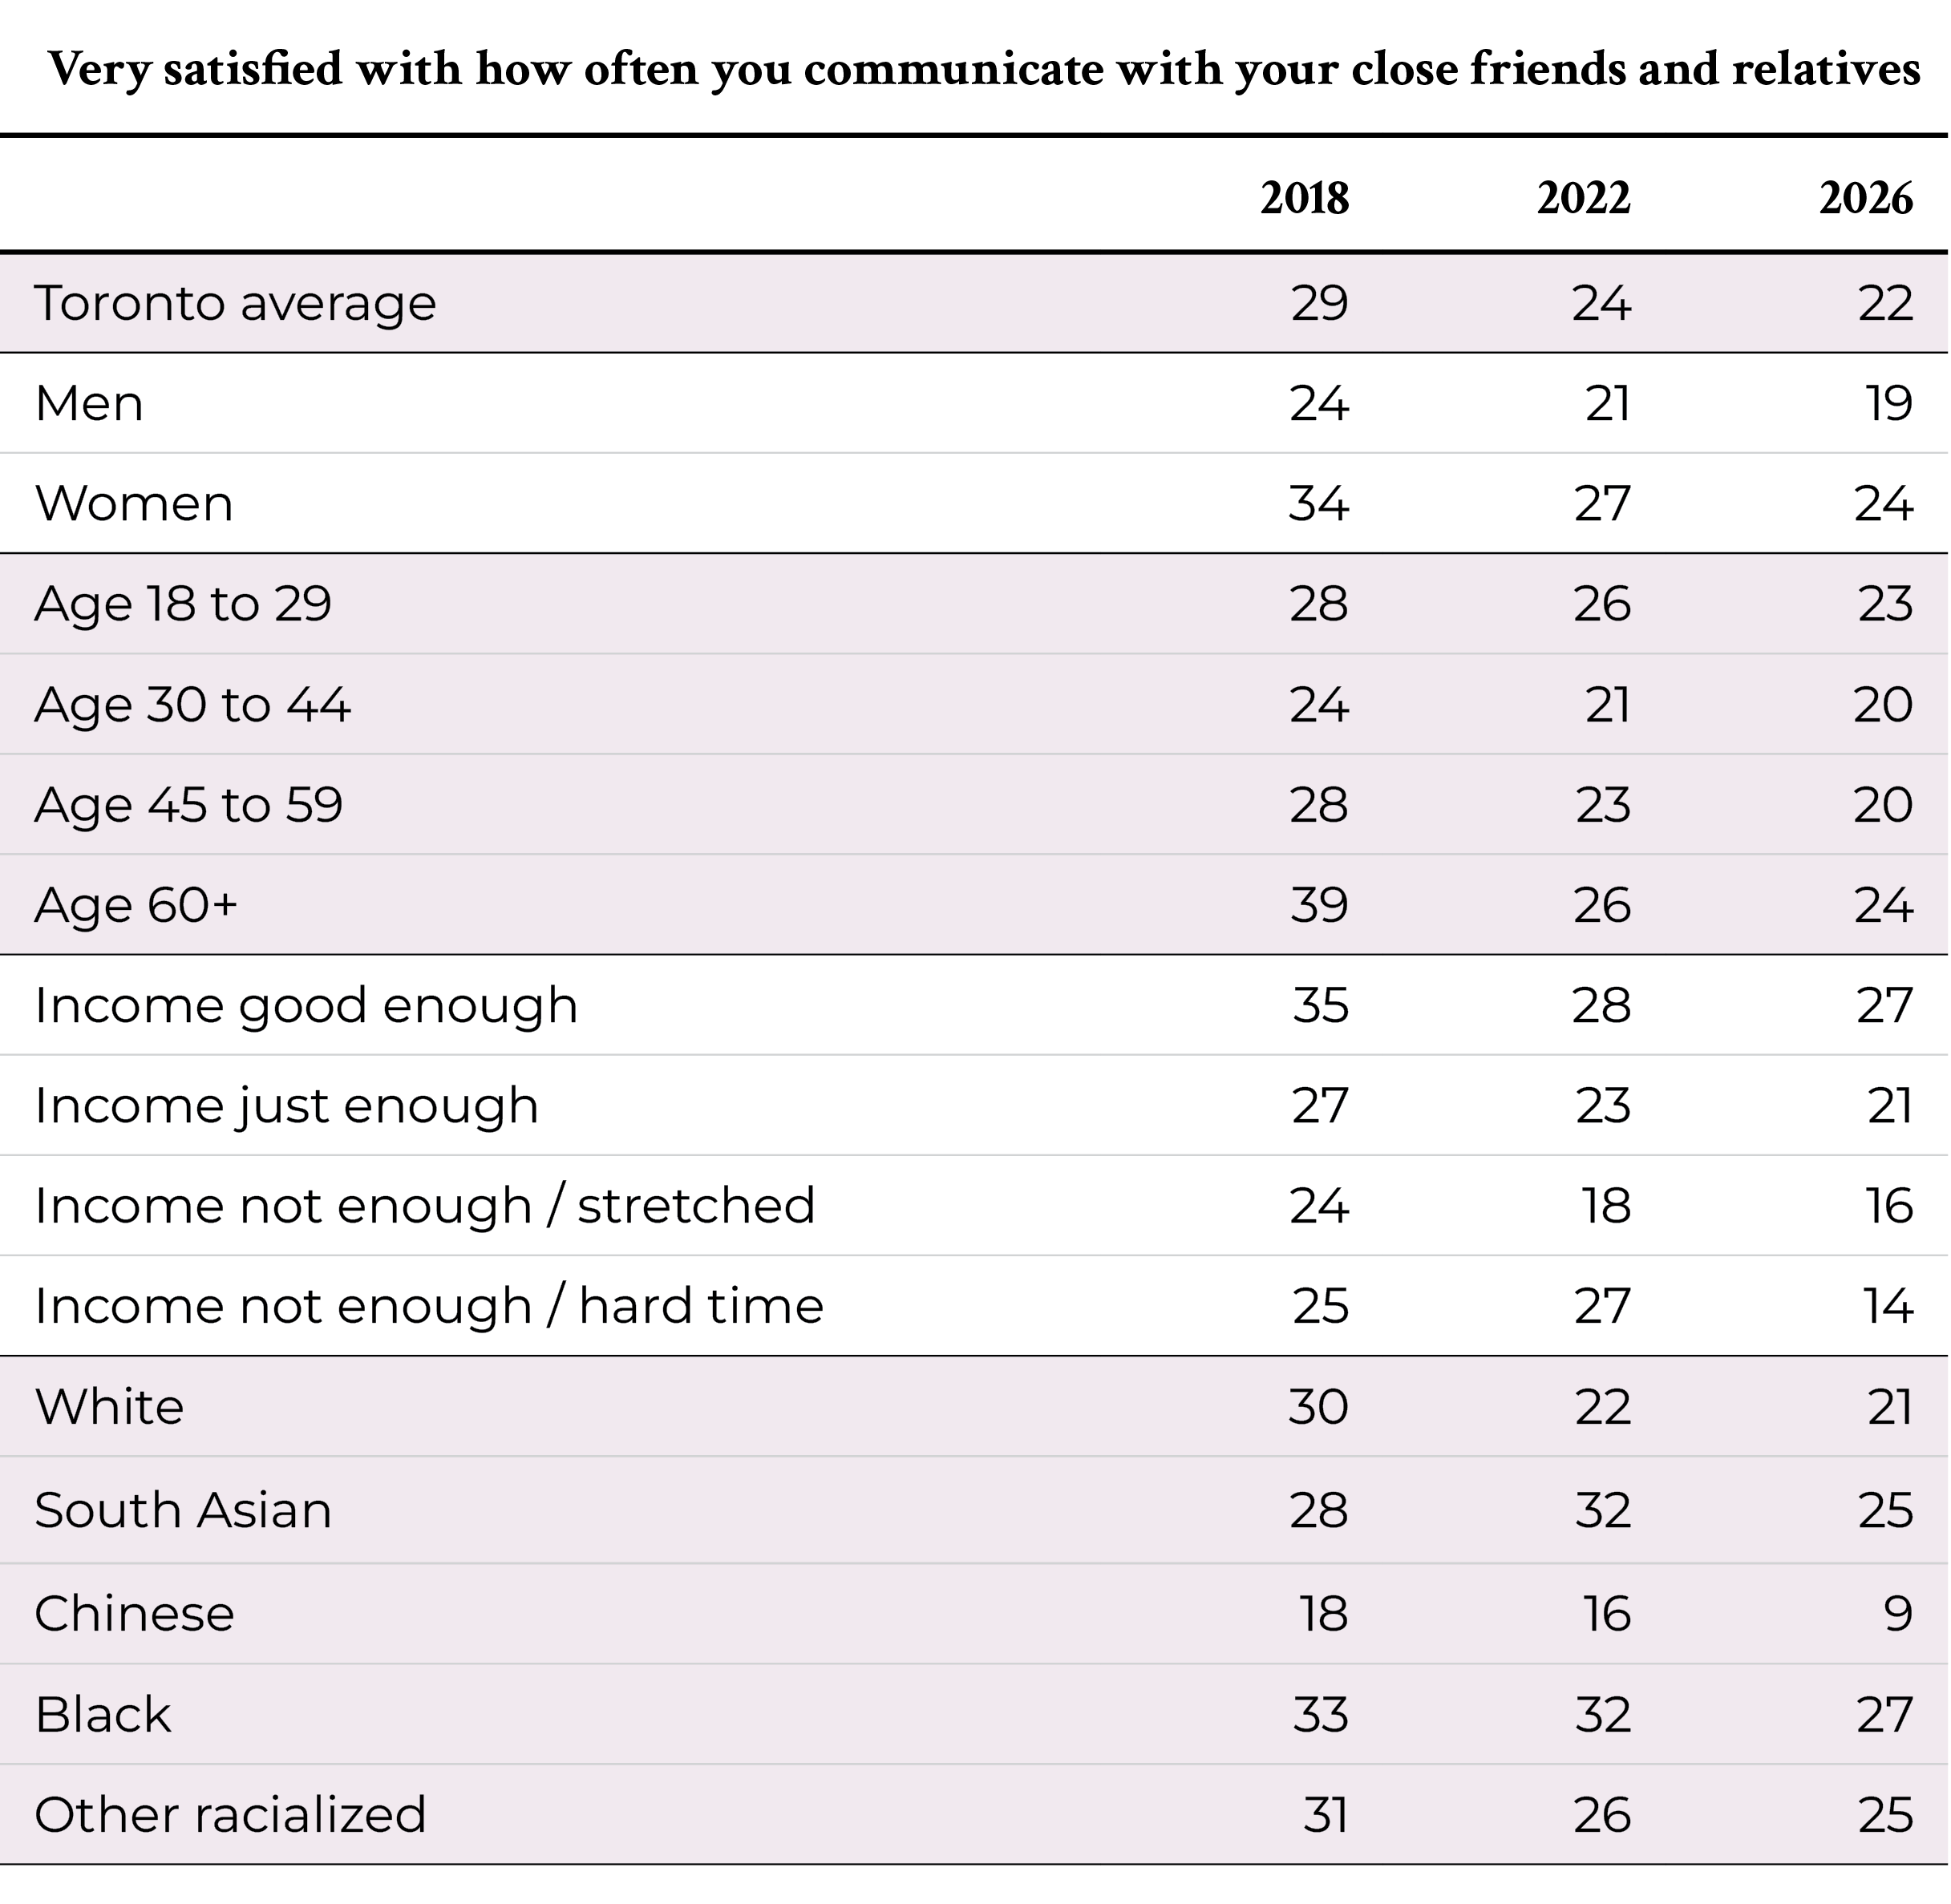
- Since 2018, the proportion of Torontonians who are very satisfied with how often they communicate with their close friends and relatives has declined from 29% to 22%. This decline is greater for residents age 60 and older (down from 39% to 24%), and those who are having a hard time because of low income (25% to 14%).
Fewer Torontonians say they always or often feel they have people they can depend on
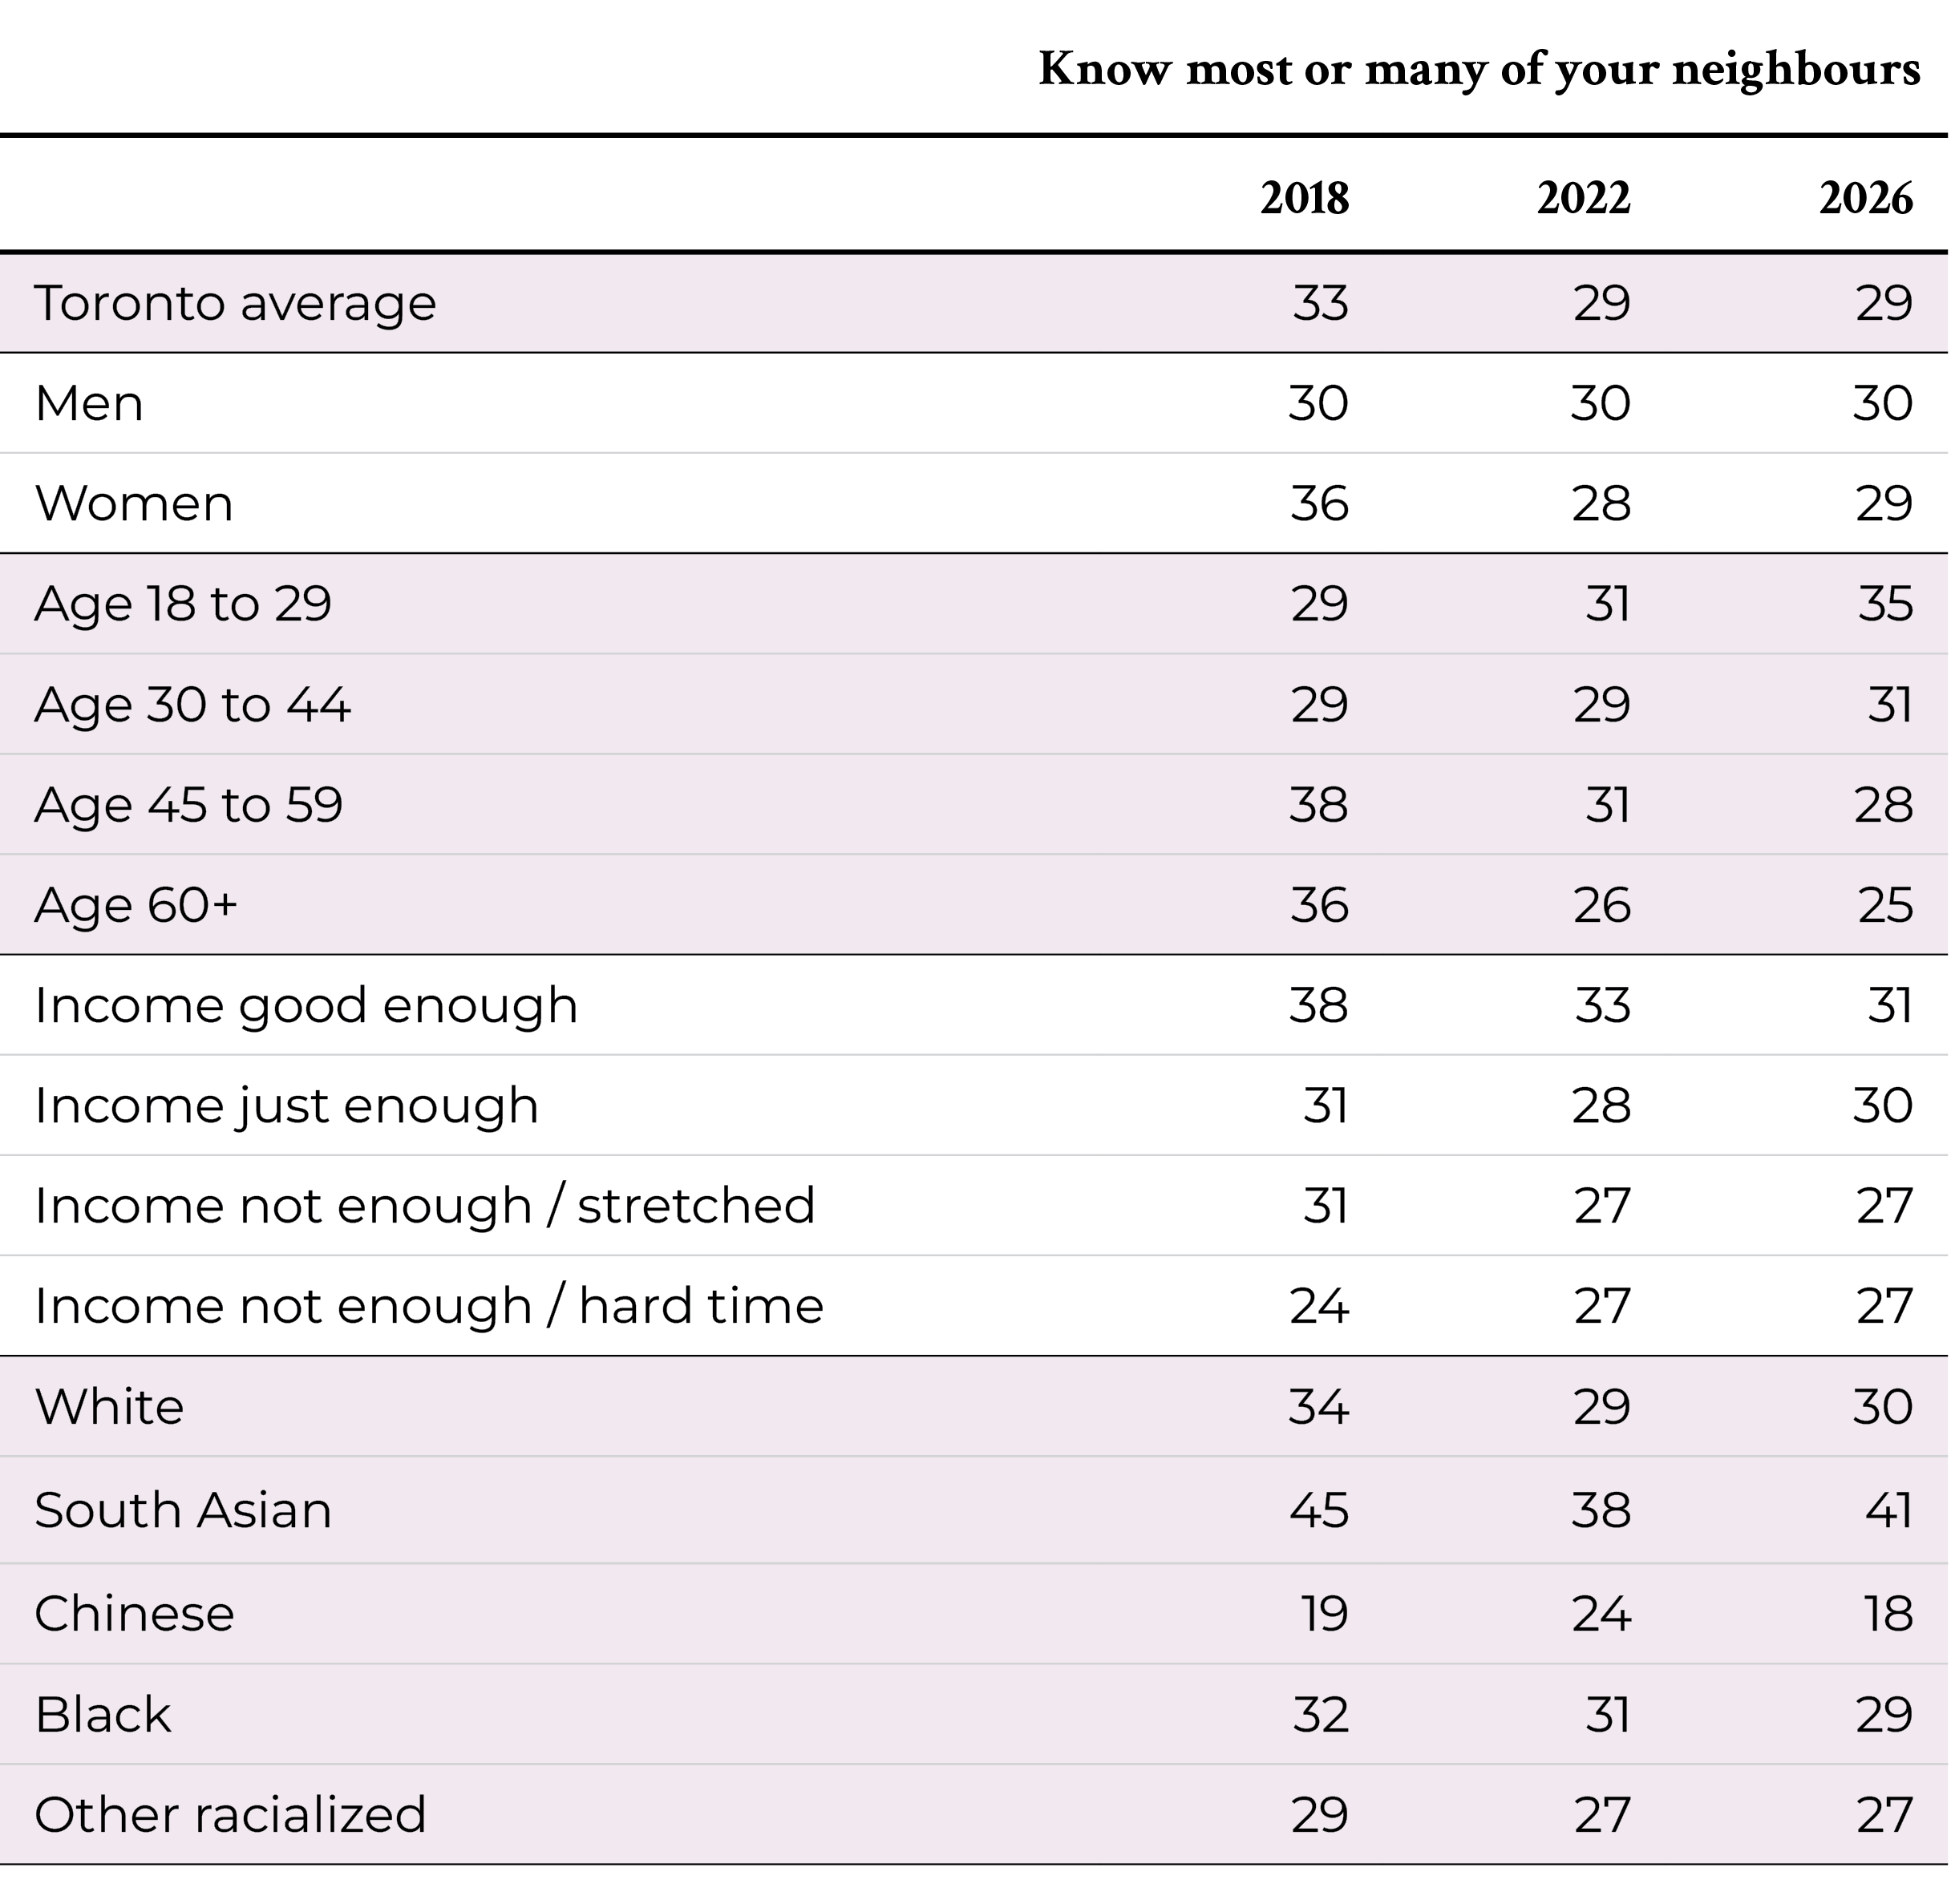
- About three in ten (29%) Torontonians say they know or most or many of the people in their neighbourhood. This overall proportion has changed little since 2018, when it stood at 33%. However, the proportion has declined by a greater amount for those age 45 to 59 (from 38% to 28%), and those age 60 and older (from 36% to 25%).
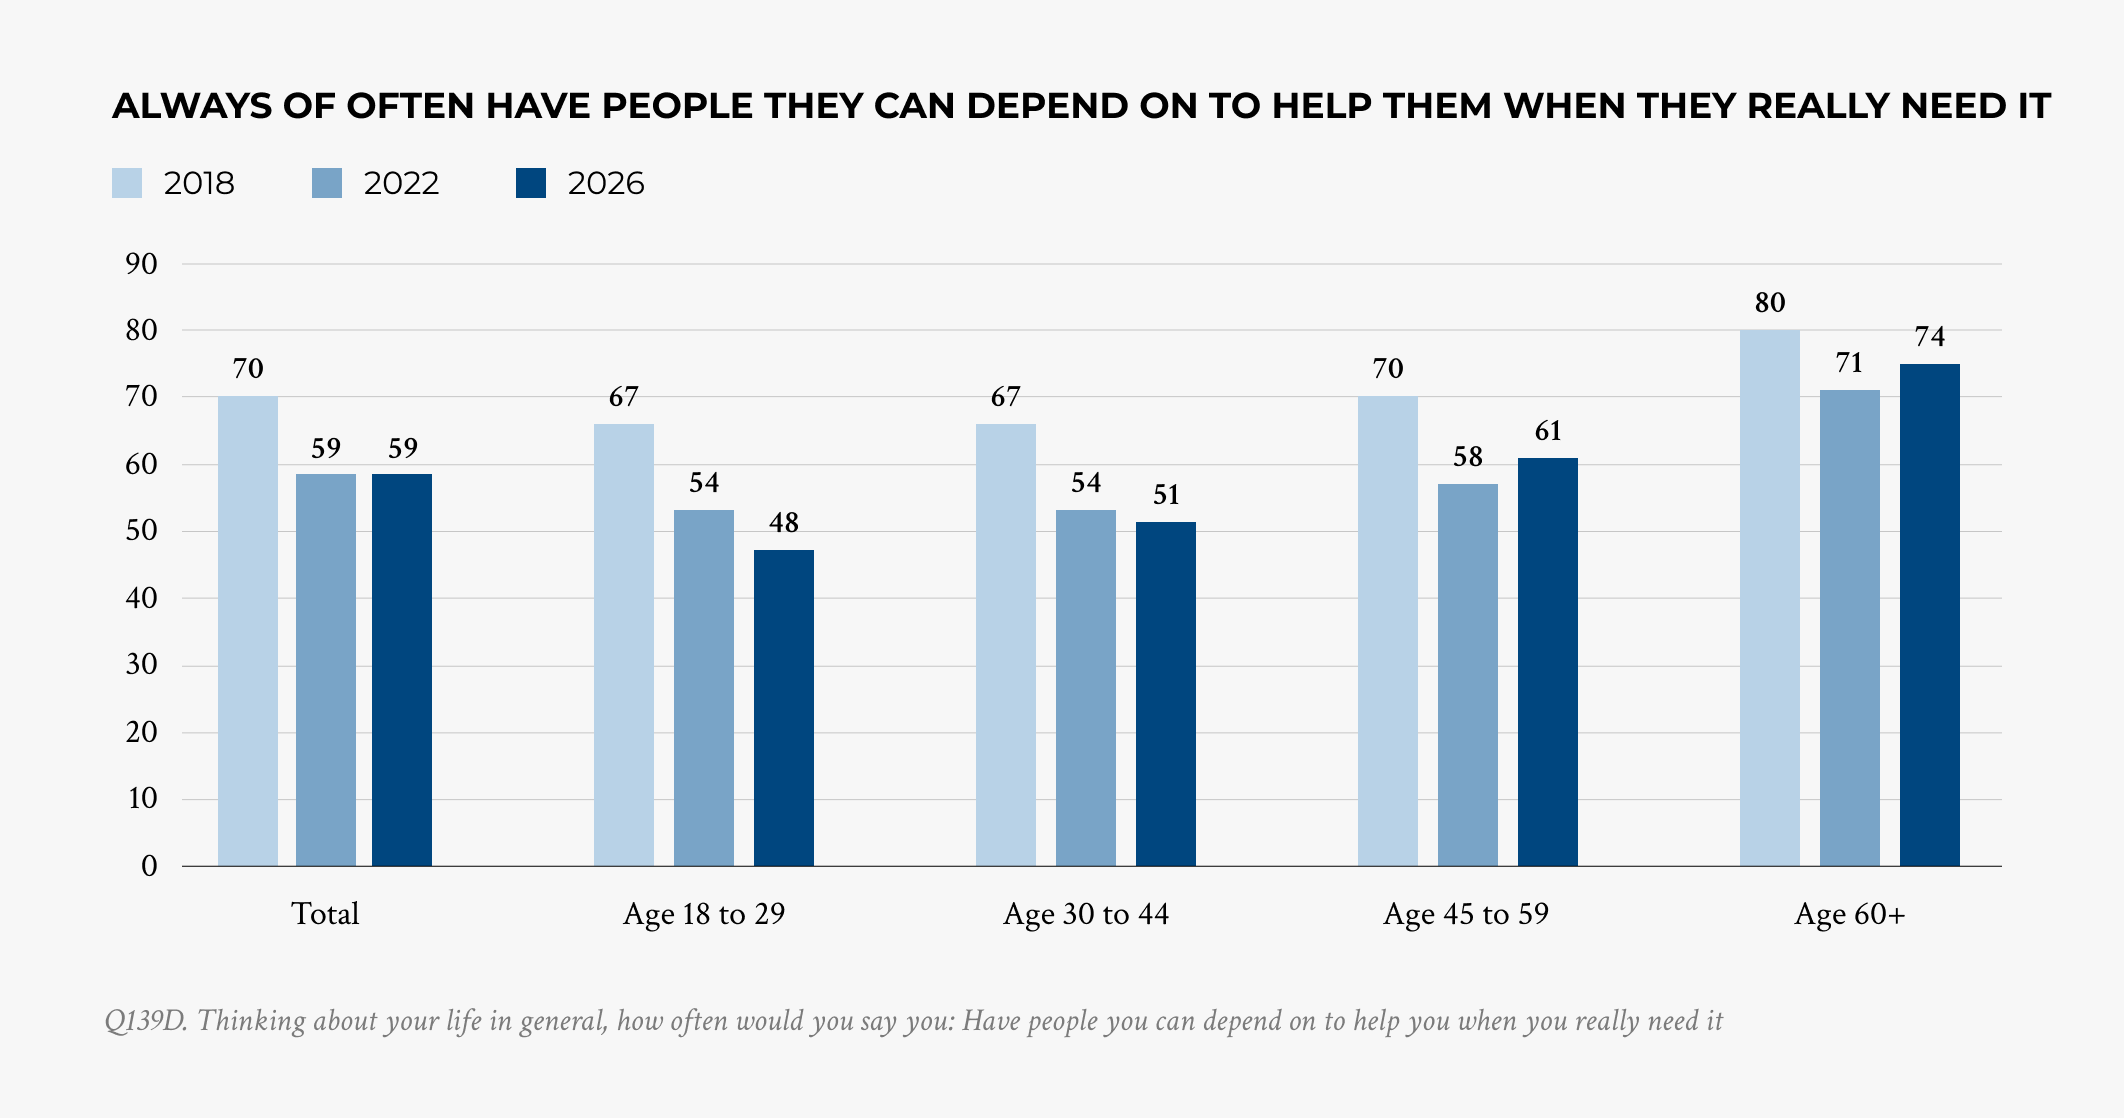
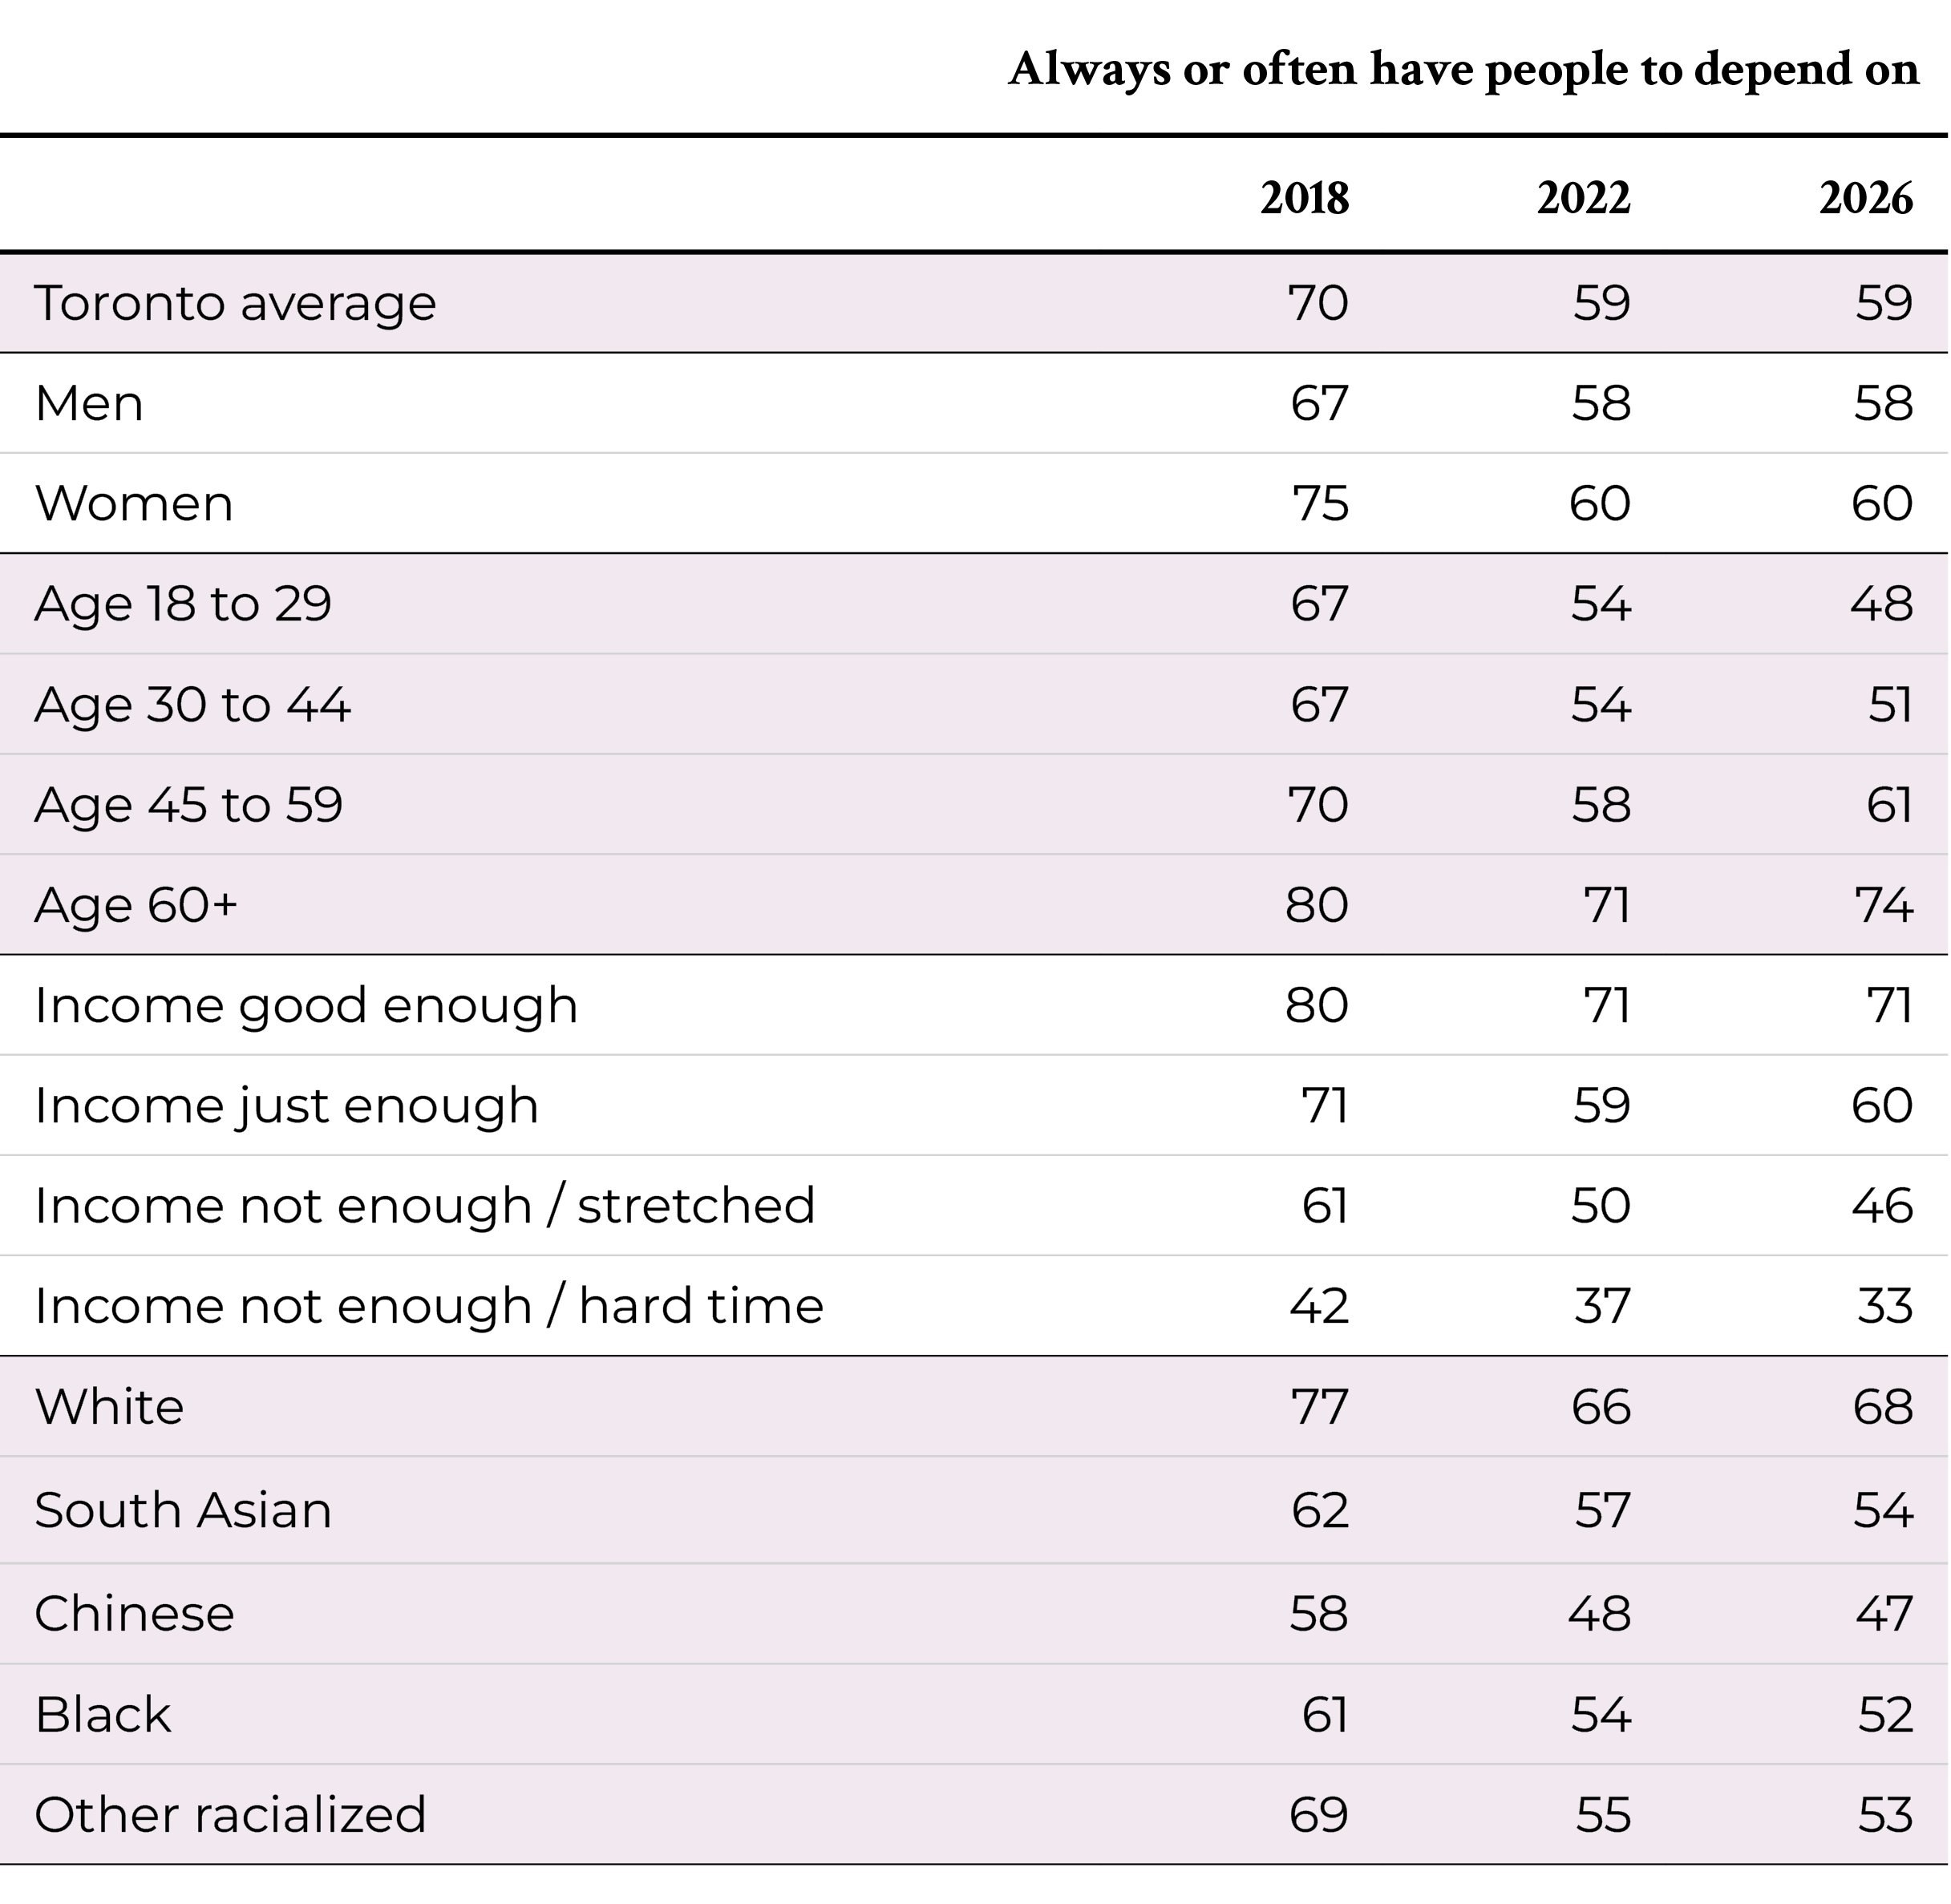
- Fewer Torontonians say they always or often feel they have people they can depend on to help them when they really need it. This proportion fell from 70% in 2018 to 59% in 2022, and remains at 59% in 2026.
- The drop in the proportion saying they always or often feel they have people they can depend on is greater for younger people in the city (falling from 67% to 48% for those age 18 to 29, and 67% to 51% for those at 30 to 44).
Social networks and social capital
One essential dimension of social capital is the presence and quality of personal connections that individuals have with others through their social networks, including connection with family, friends, neighbours and others in their communities.
The social network index
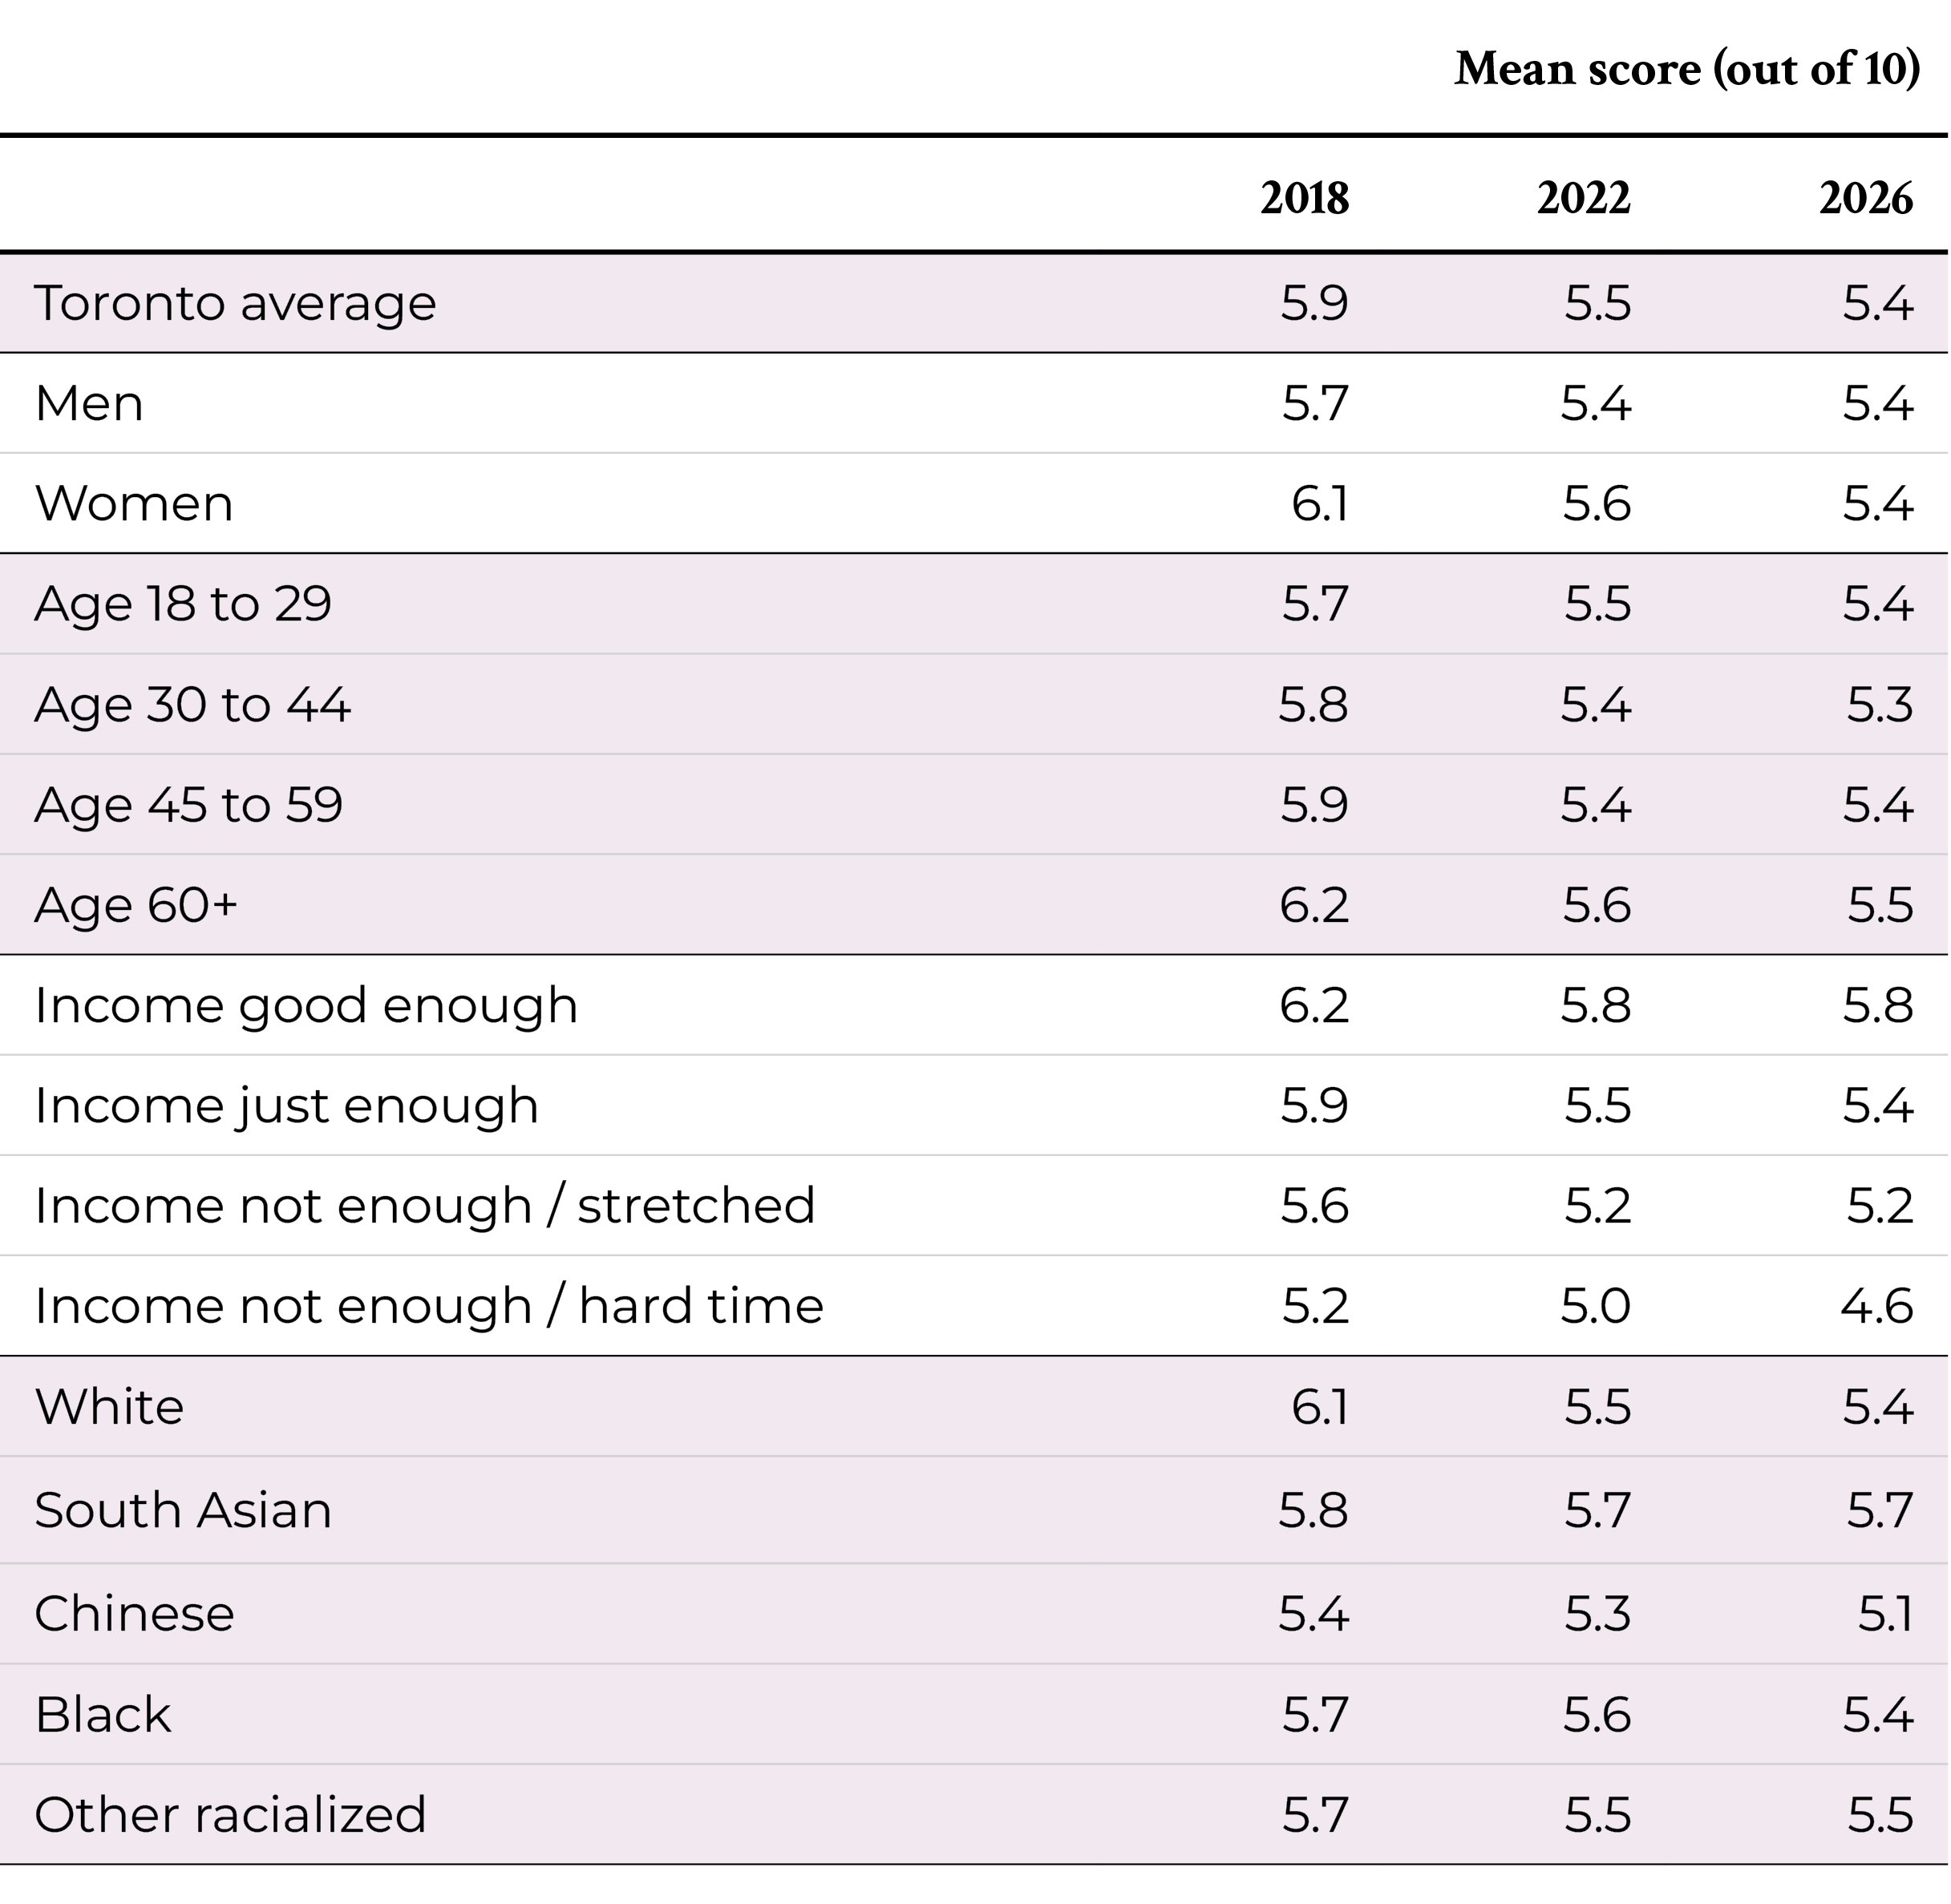
The survey results relating to connections with family and friends (including the number and proximity of friends and relatives, and the frequency of contact) are combined to form a single index of social networks that provides the basis for identifying how this form of social capital varies across Toronto and how it has changed since 2018. The index is scored from “0” (lowest possible score) to “10” (highest possible score).
Data Tables
See more results in the complete survey data tables here.
Numbers may not add to exactly 100% due to rounding.