
Home > Vital Signs 2026 >
Economic Insecurity in Toronto
Exploring the extent of income, housing and food insecurity in the city
One in three Torontonians experience at least one of either income, food or housing insecurity. Younger adults, renters, individuals with disabilities, and people with poorer mental health are all more likely to face at least one of these forms of insecurity.
One in three Torontonians experience at least one of either income, food or housing insecurity.
Definitions of income, food and housing insecurity shared below.
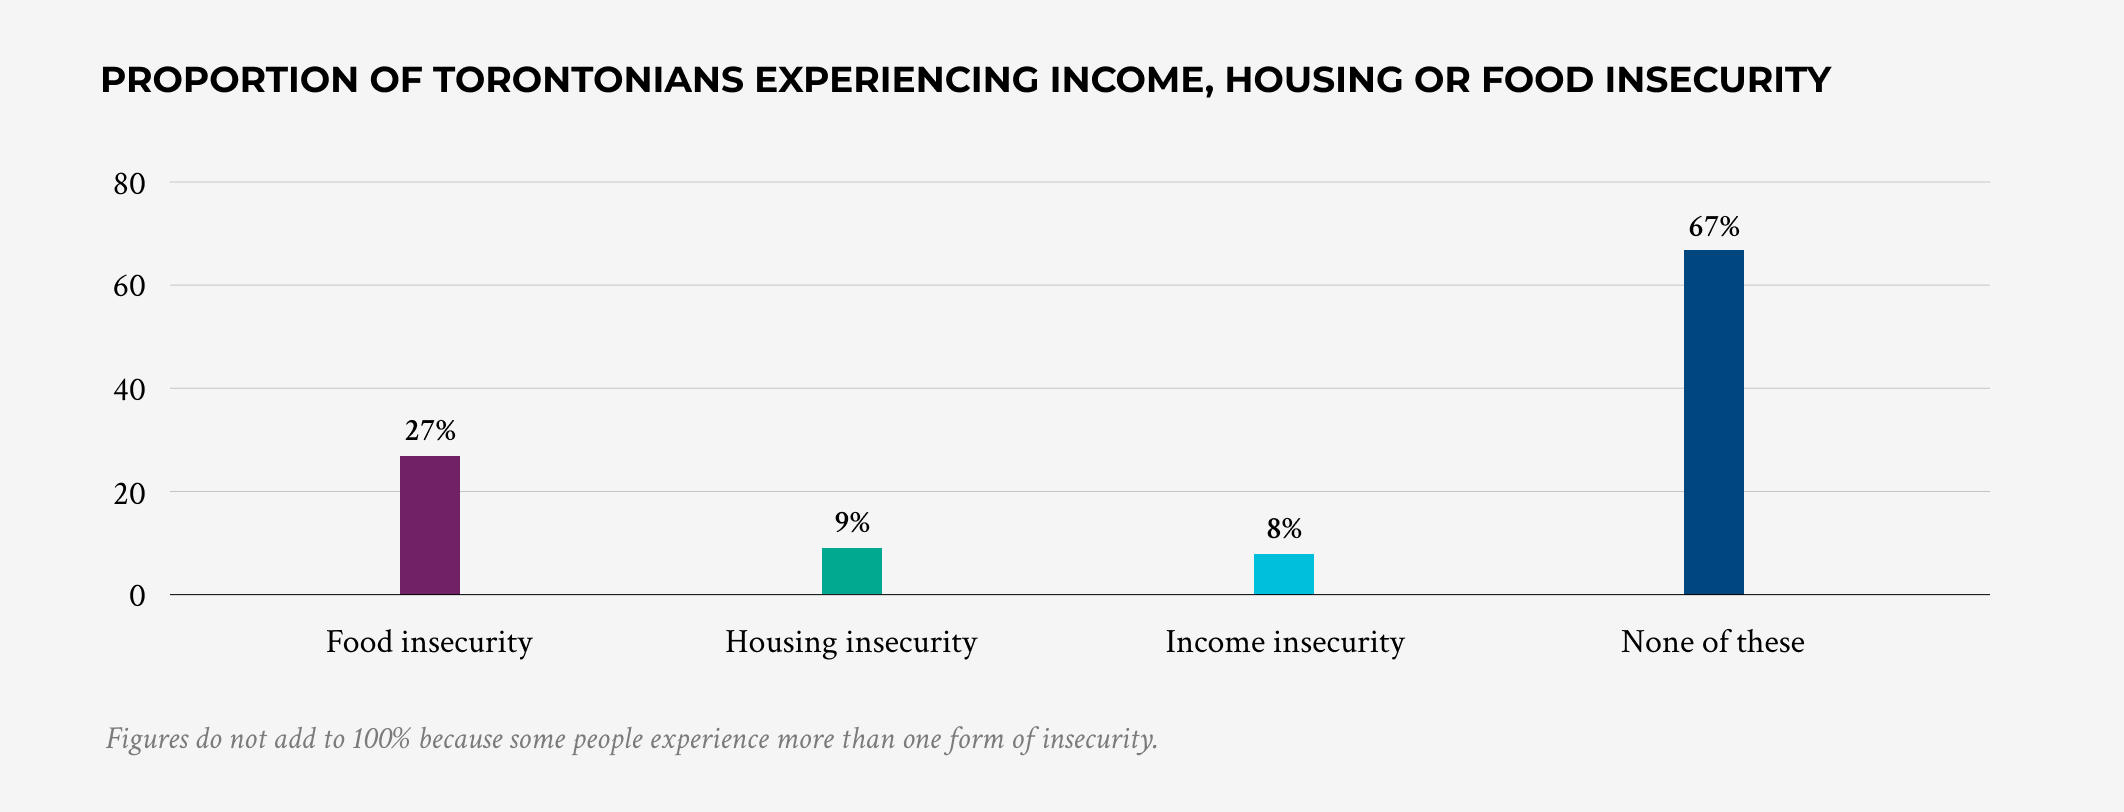
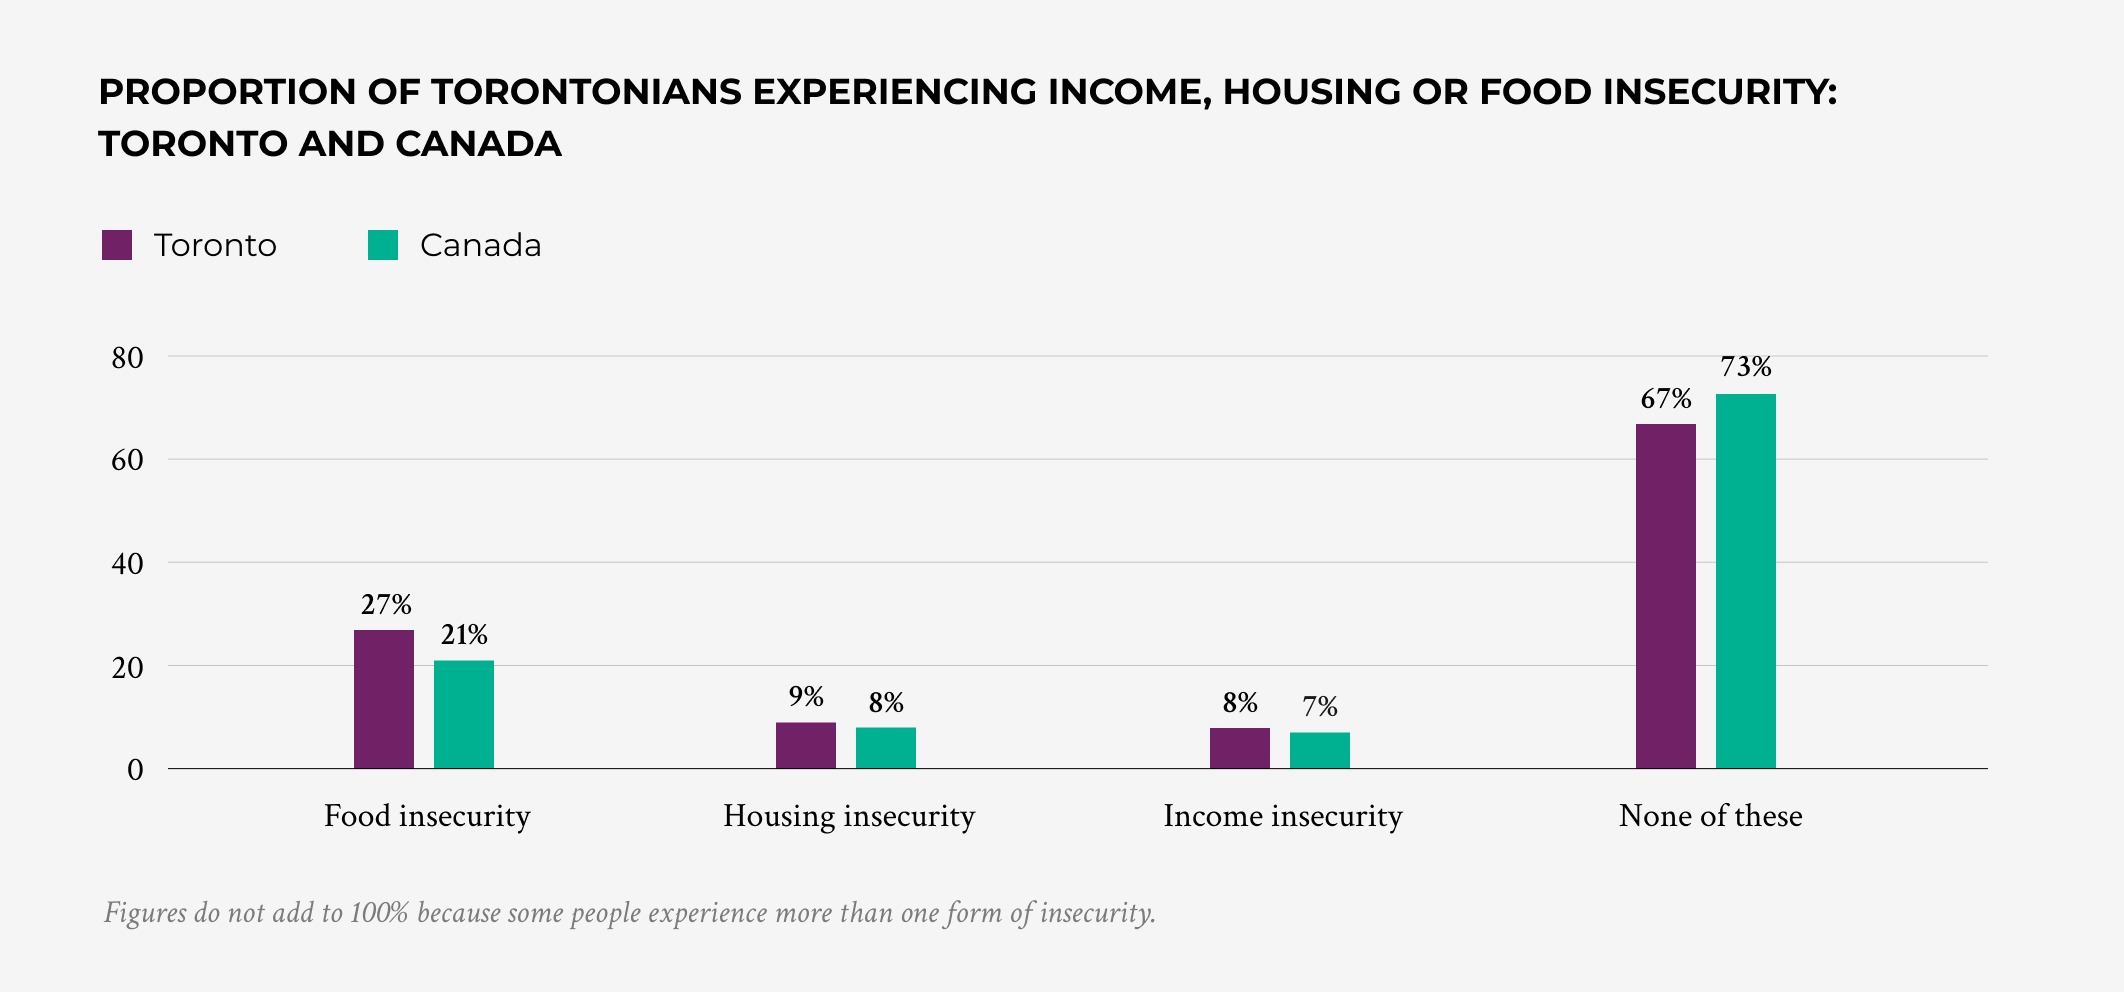
- The Toronto Social Capital study includes three measures of economic insecurity: income insecurity, food insecurity and housing insecurity. Overall, one in three (33%) city residents experience at least one of these three forms of insecurity, while two-thirds (67%) do not experience any of them.
- Food insecurity is the most common form of economic insecurity: 27% of Torontonians are experiencing food insecurity, compared with 9% who are experiencing housing insecurity and 8% who are experiencing income insecurity.
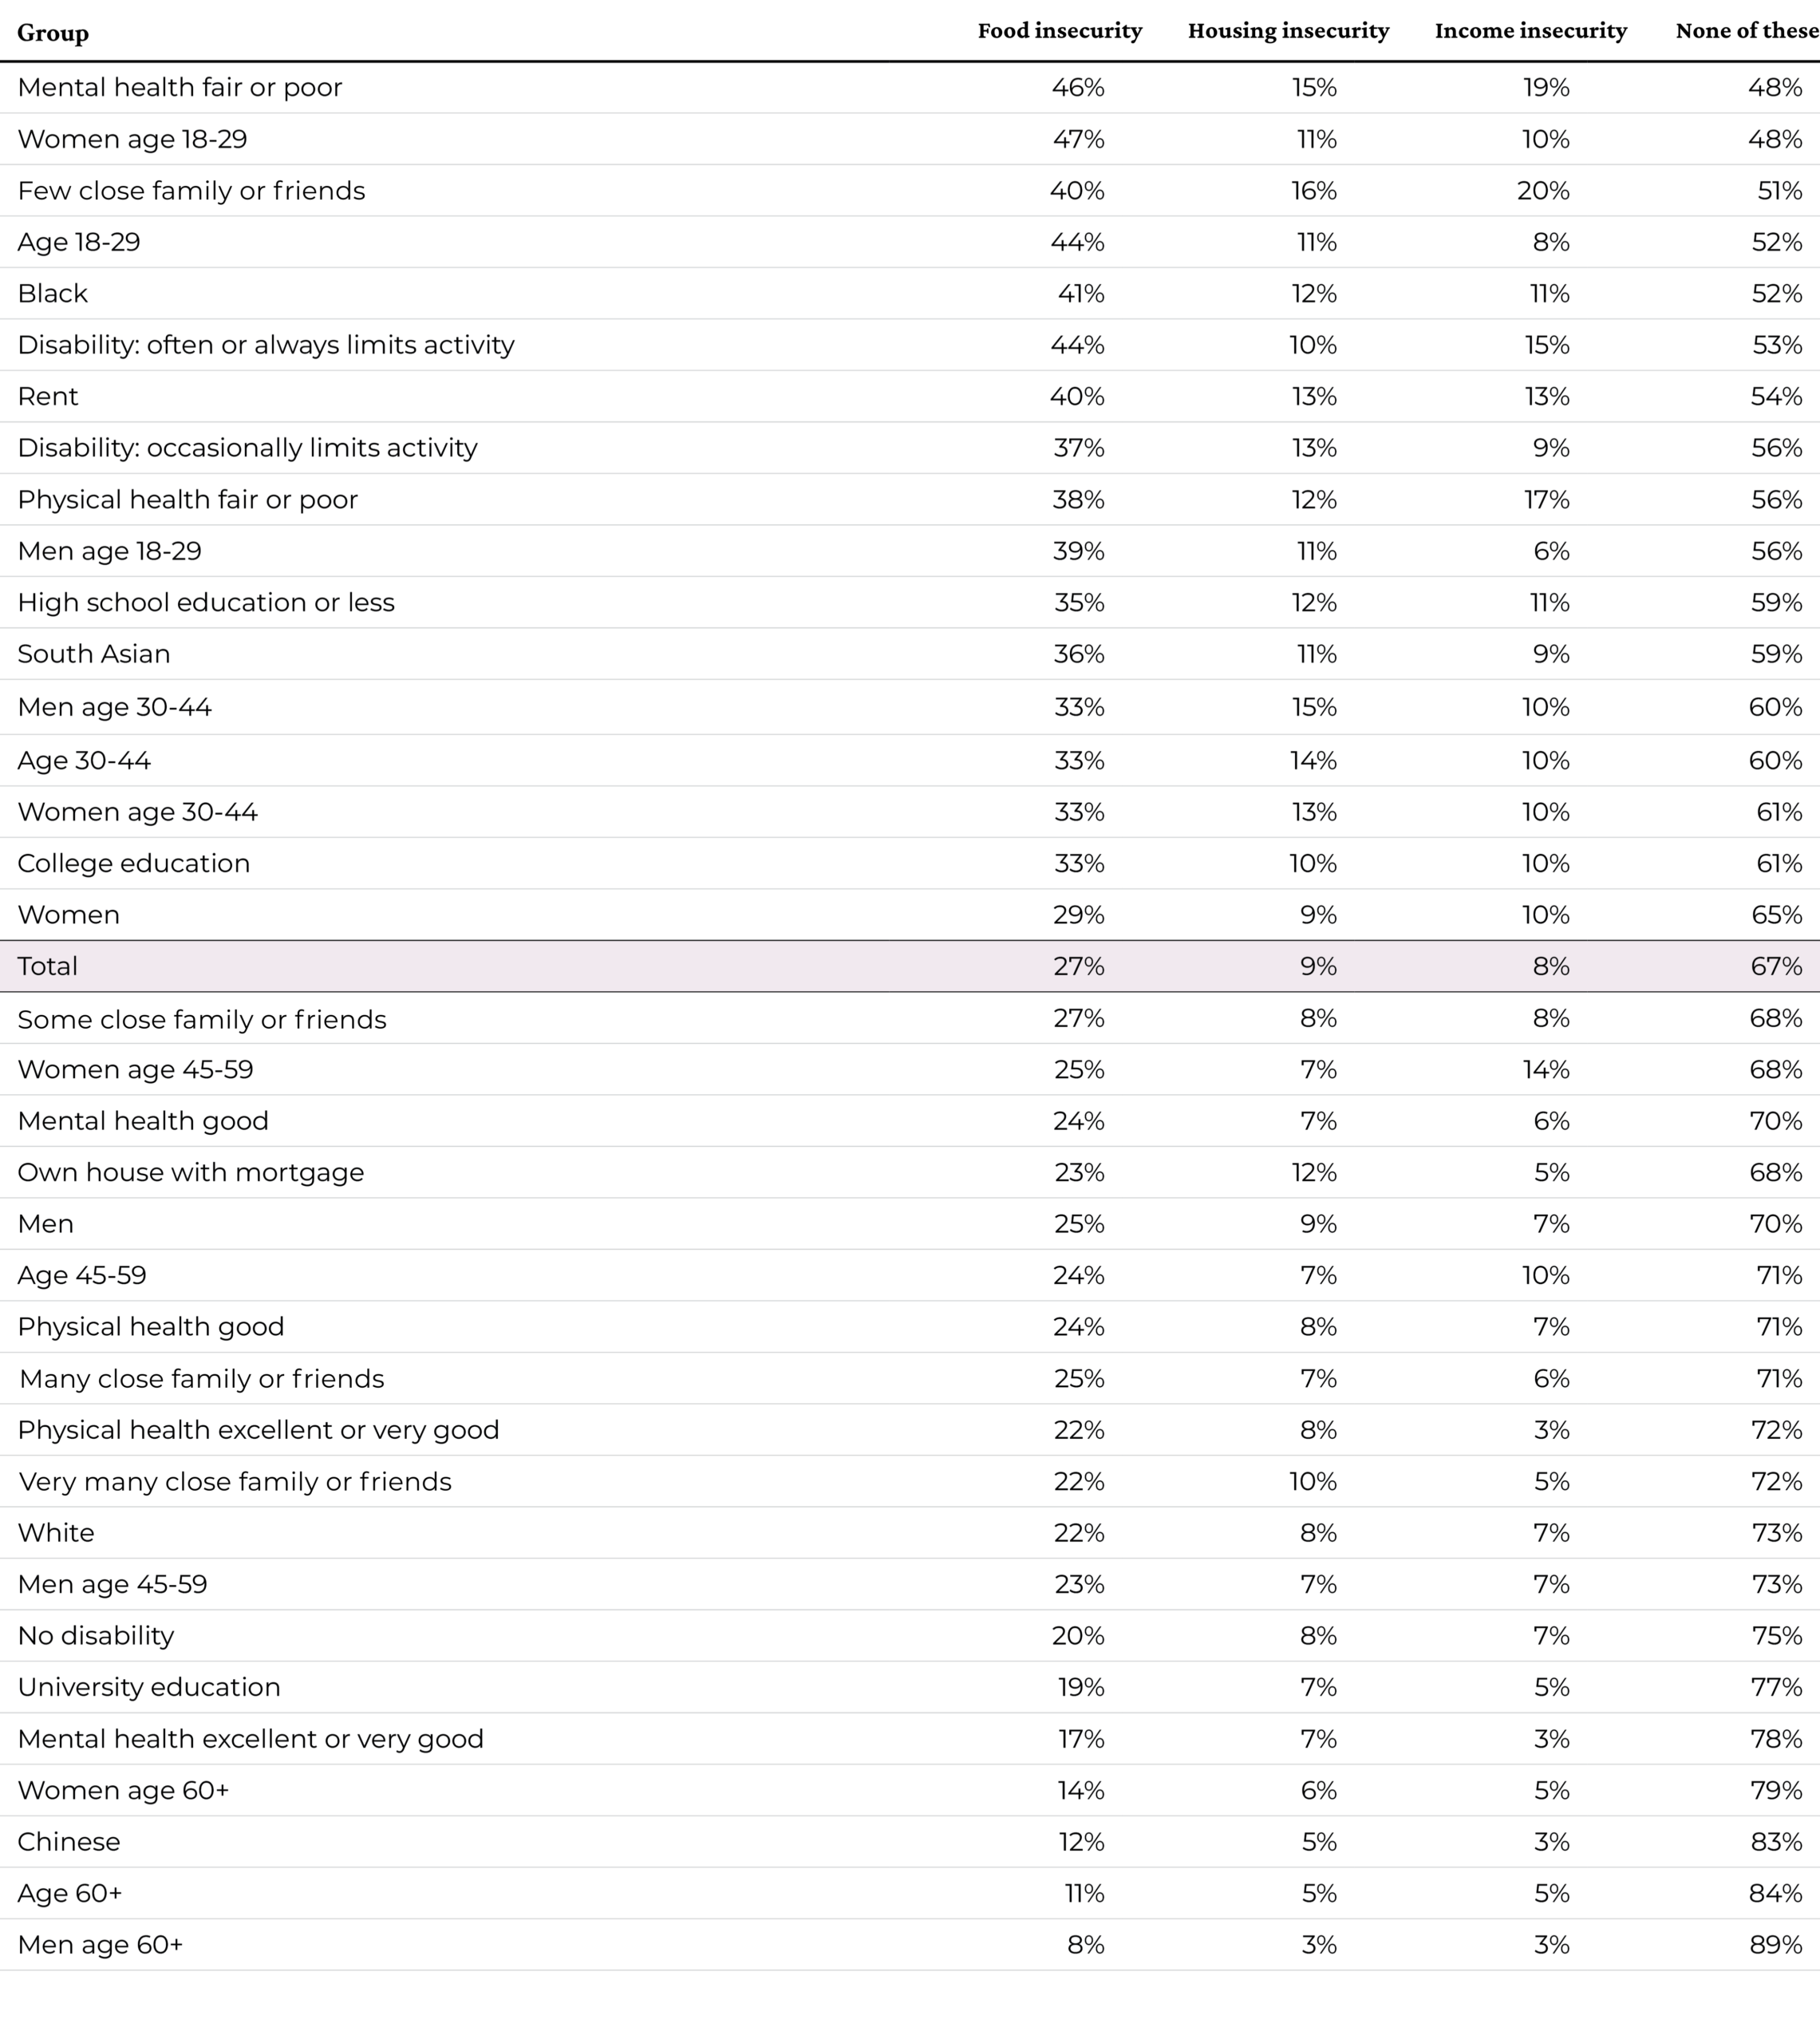
- Economic insecurity is more common among those whose social networks are more limited: the proportion facing none of the three forms of insecurity rises from 51% among those with very few close family or friends, to 72% among those with many close family or friends.
Economic insecurity in Toronto is more common among younger residents of the city.
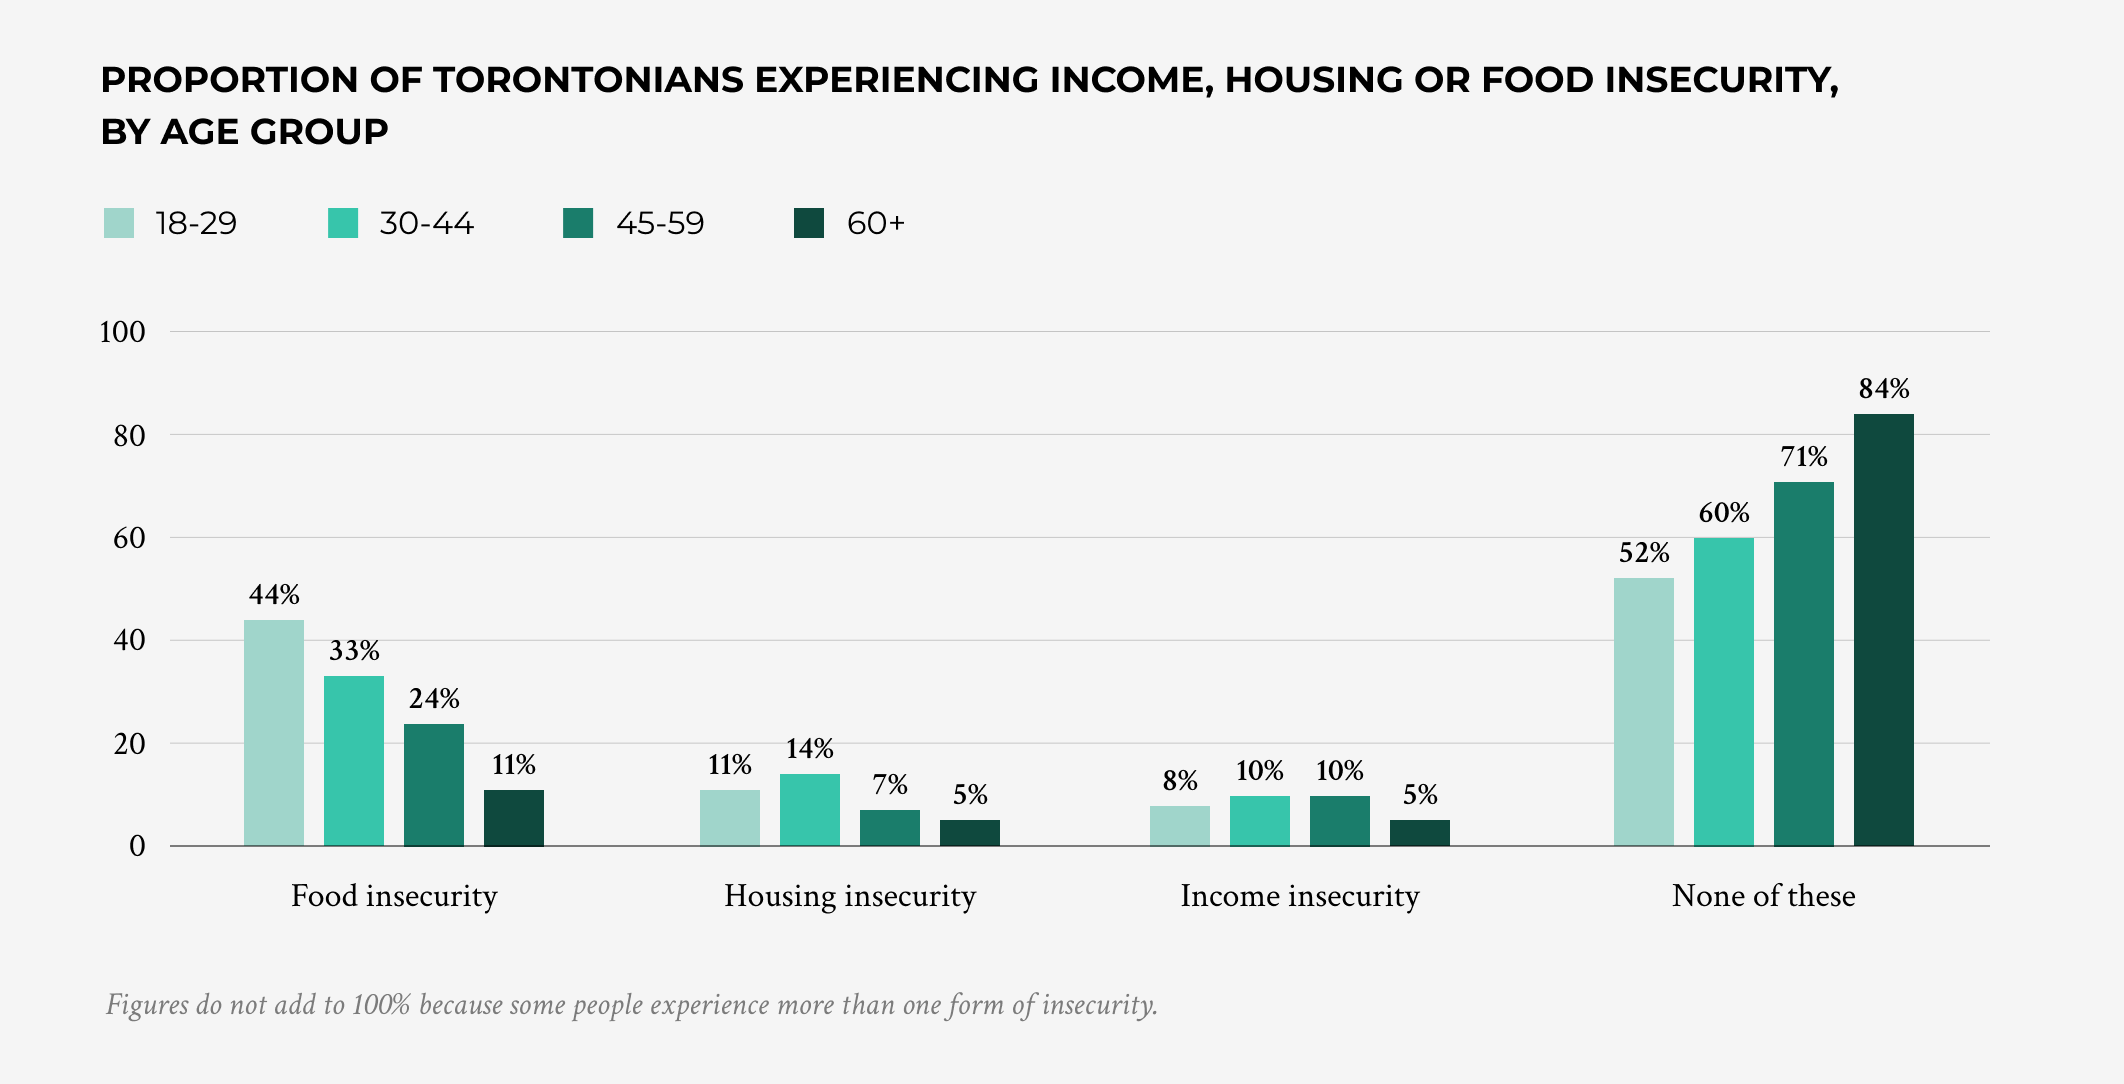
- Each of the three forms of economic insecurity are more common among younger city residents. Respondents aged 18-29 are more likely than those aged 60 and older to experience food insecurity, housing insecurity and income insecurity, and less likely to experience none of these forms of insecurity (52%, compared to 84%).
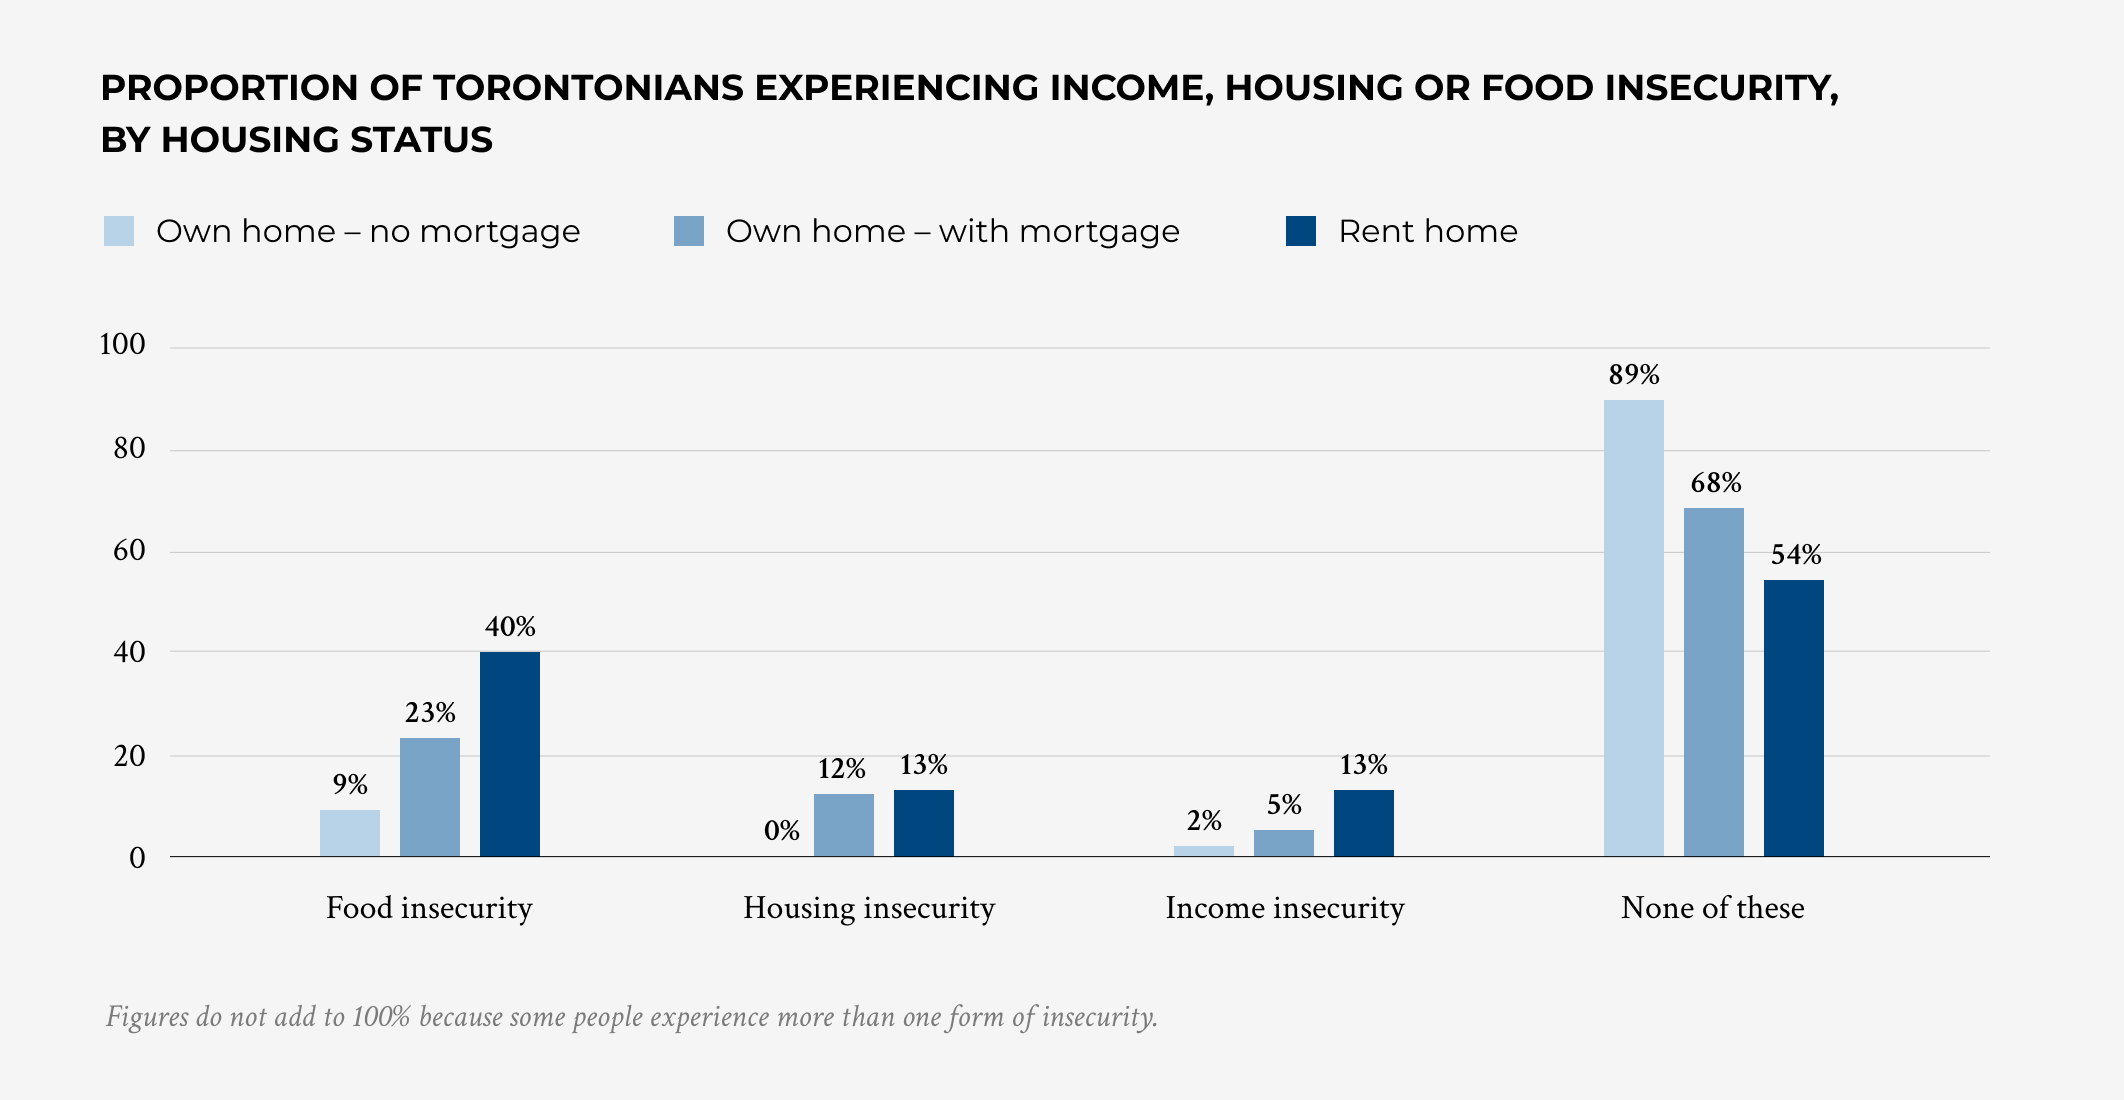
Torontonians who rent their homes are more likely to face economic insecurity.
- By definition, homeowners in Toronto with no mortgage do not face housing insecurity. But they also are less likely to face food and income insecurity. Nine in ten (89%) homeowners with no mortgage face none of the three forms of economic insecurity.
- In contrast, only 54% of renters in Toronto face none of the three forms of economic insecurity.
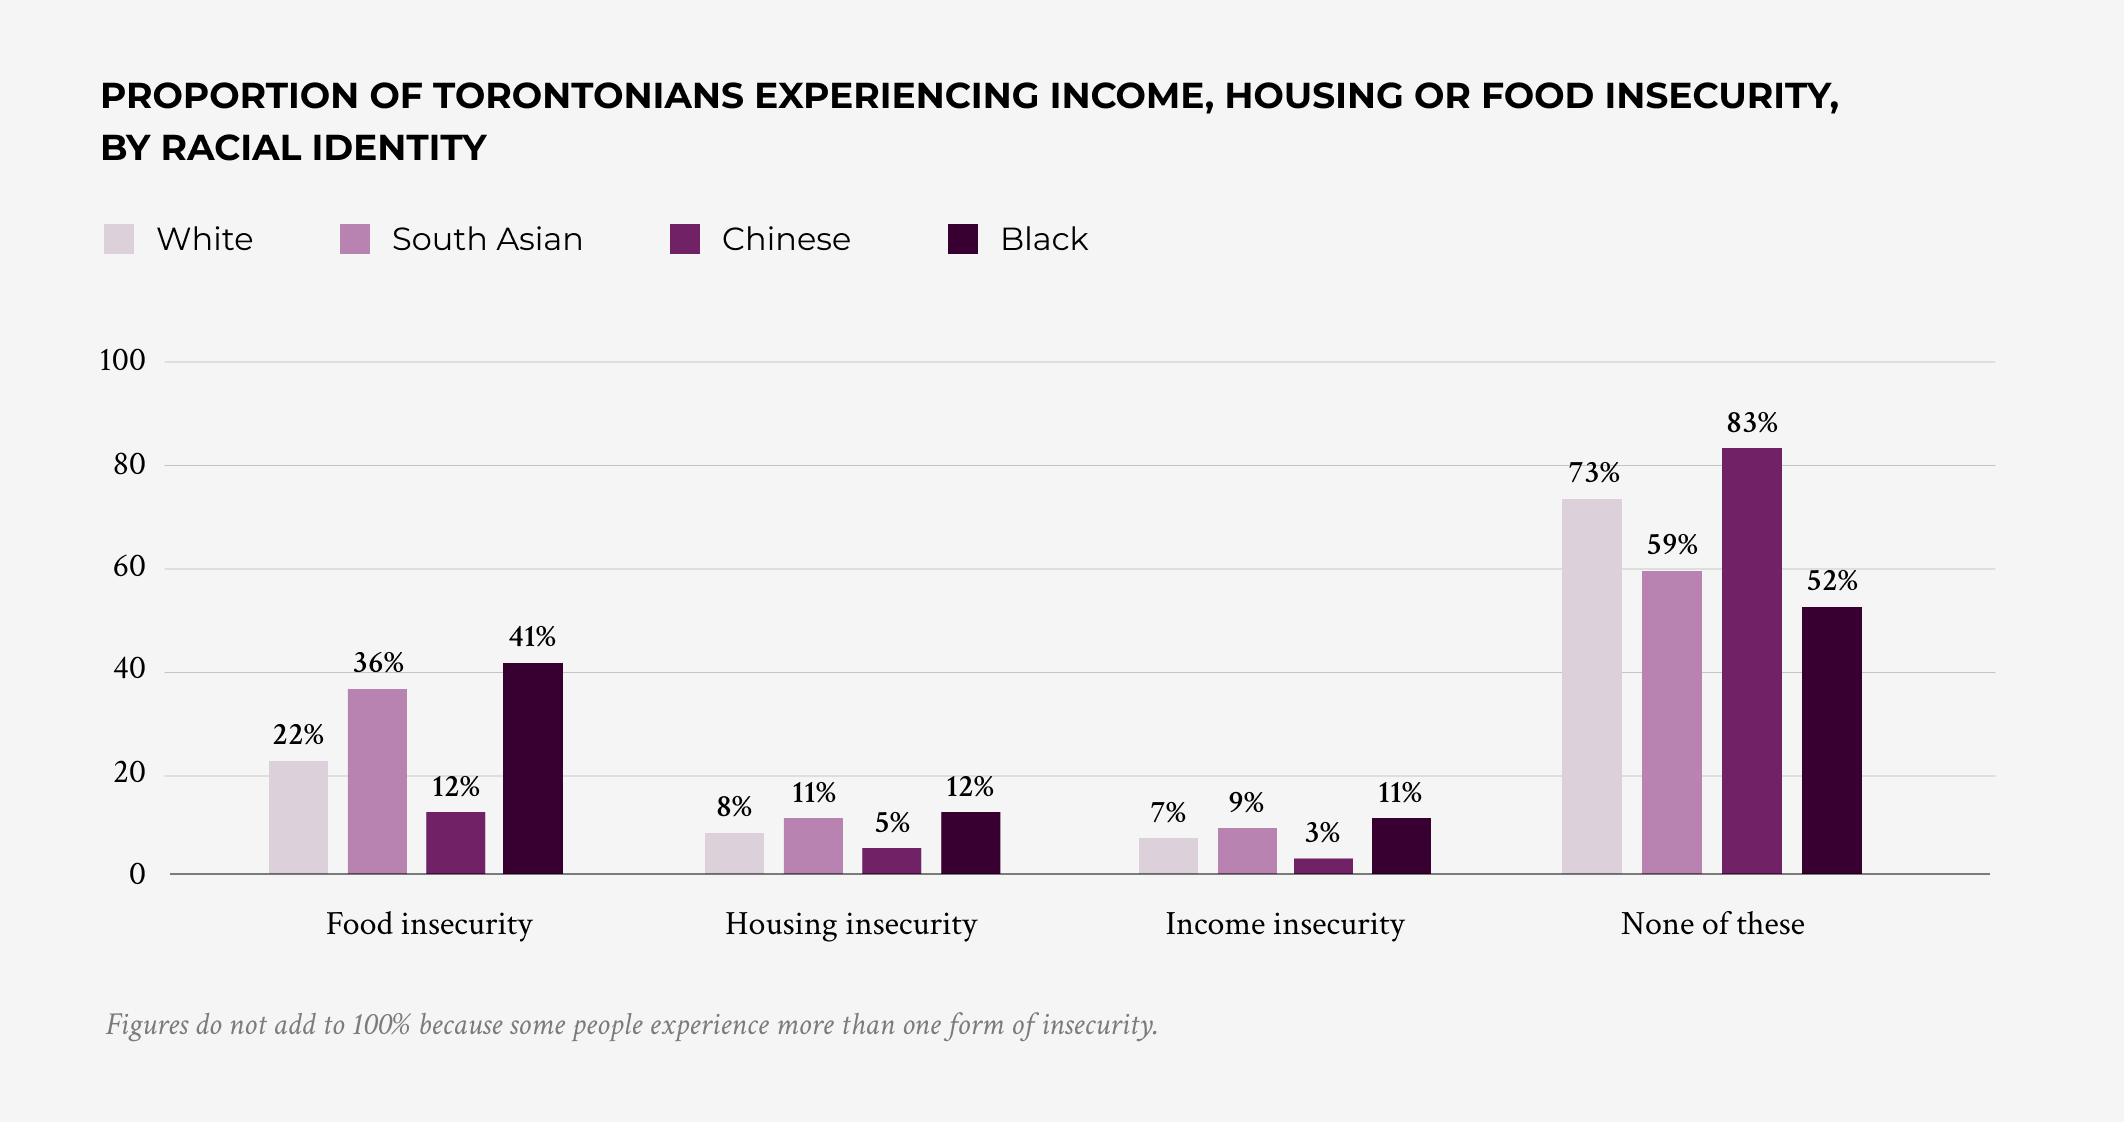
Economic insecurity in Toronto varies considerably based on racial identity.
- Torontonians who identify as white (73%) or Chinese (83%) are less likely to face any of the three forms of economic insecurity.
- By contrast, smaller proportions of South Asian (59%) and Black (52%) Torontonians experience none of the three forms of economic insecurity.
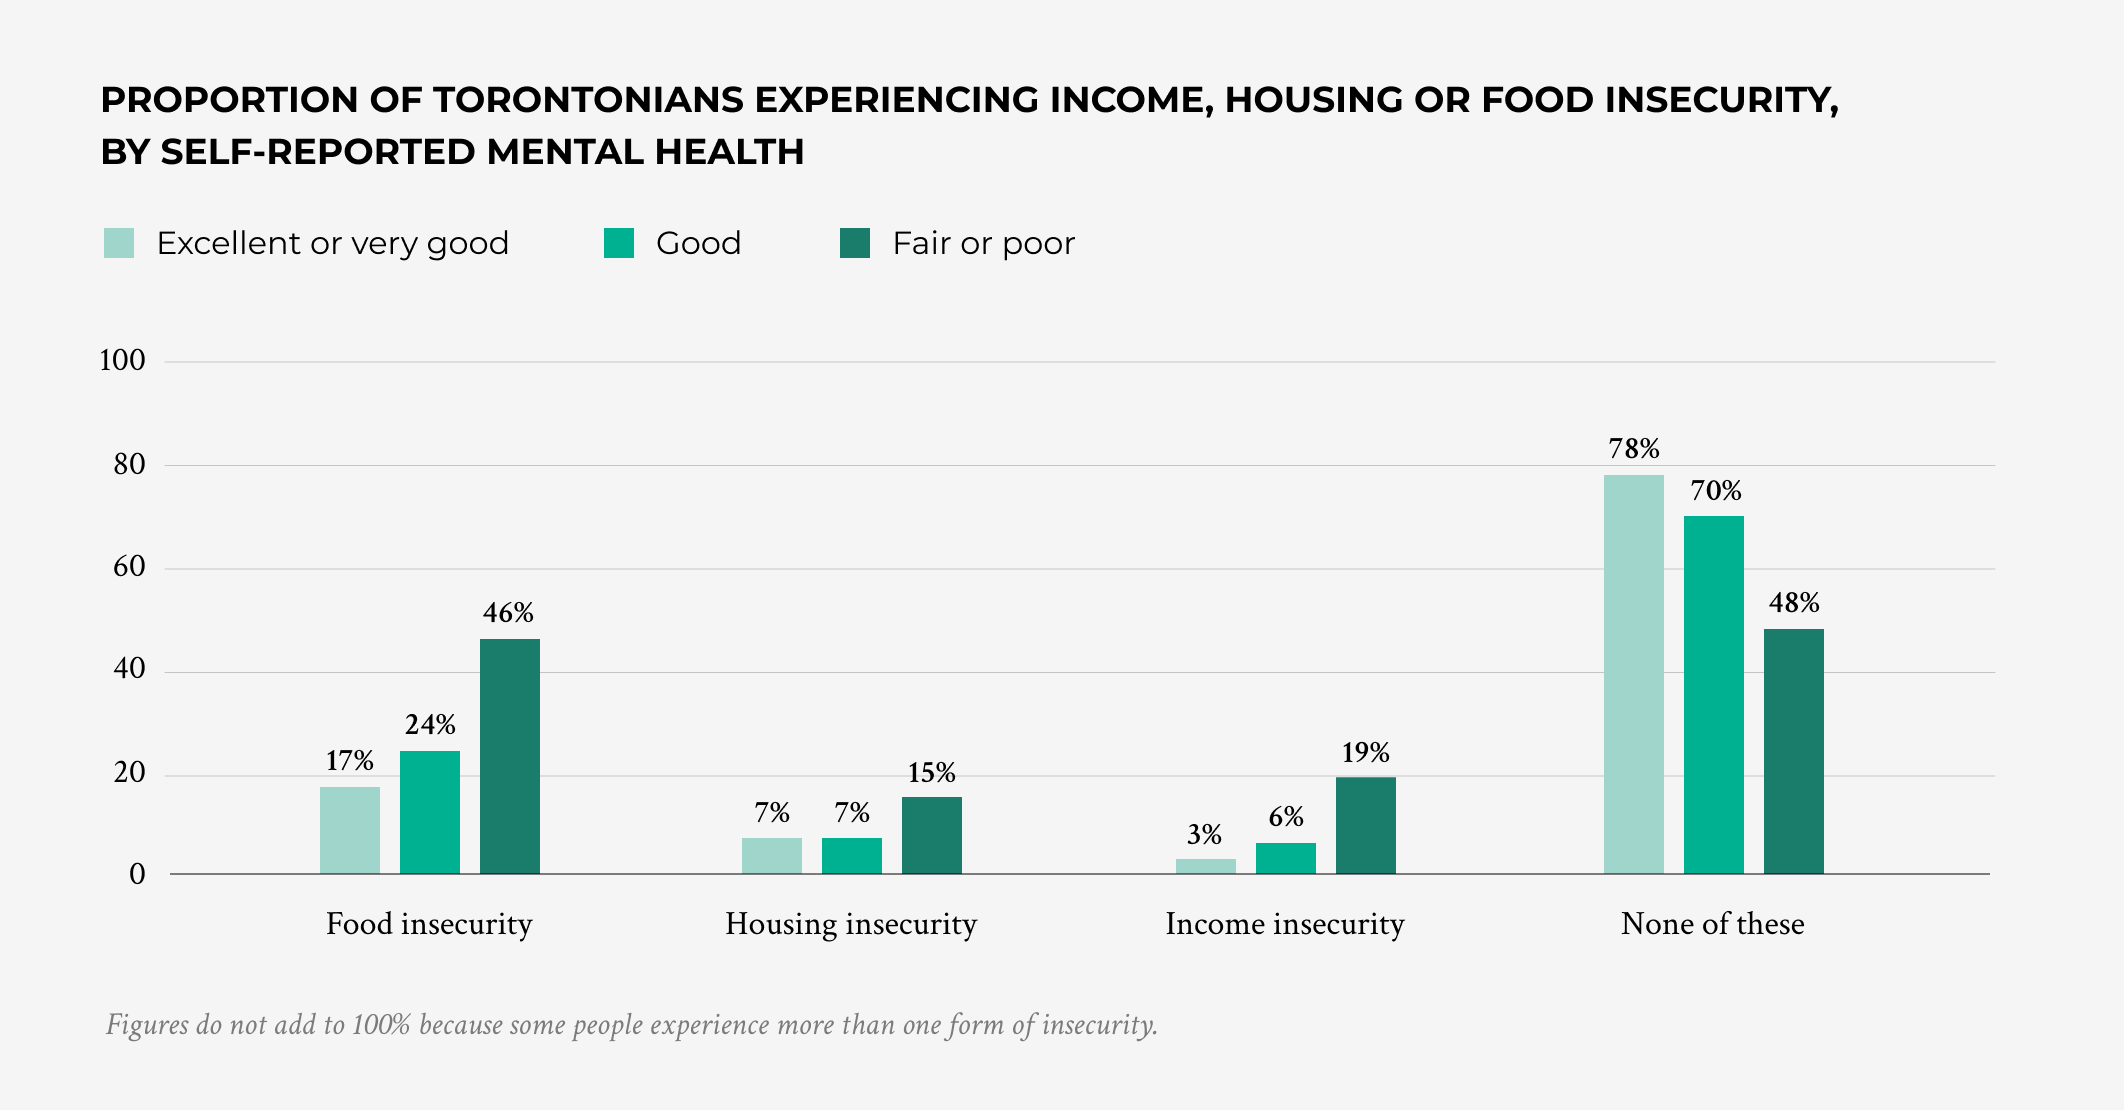
There is a strong relationship between economic security and mental health.
- Food insecurity in particular is strongly associated with mental health: approximately half of residents reporting fair or poor mental health (46%) are food insecure, compared to 17% of those reporting that their mental health is excellent or very good.
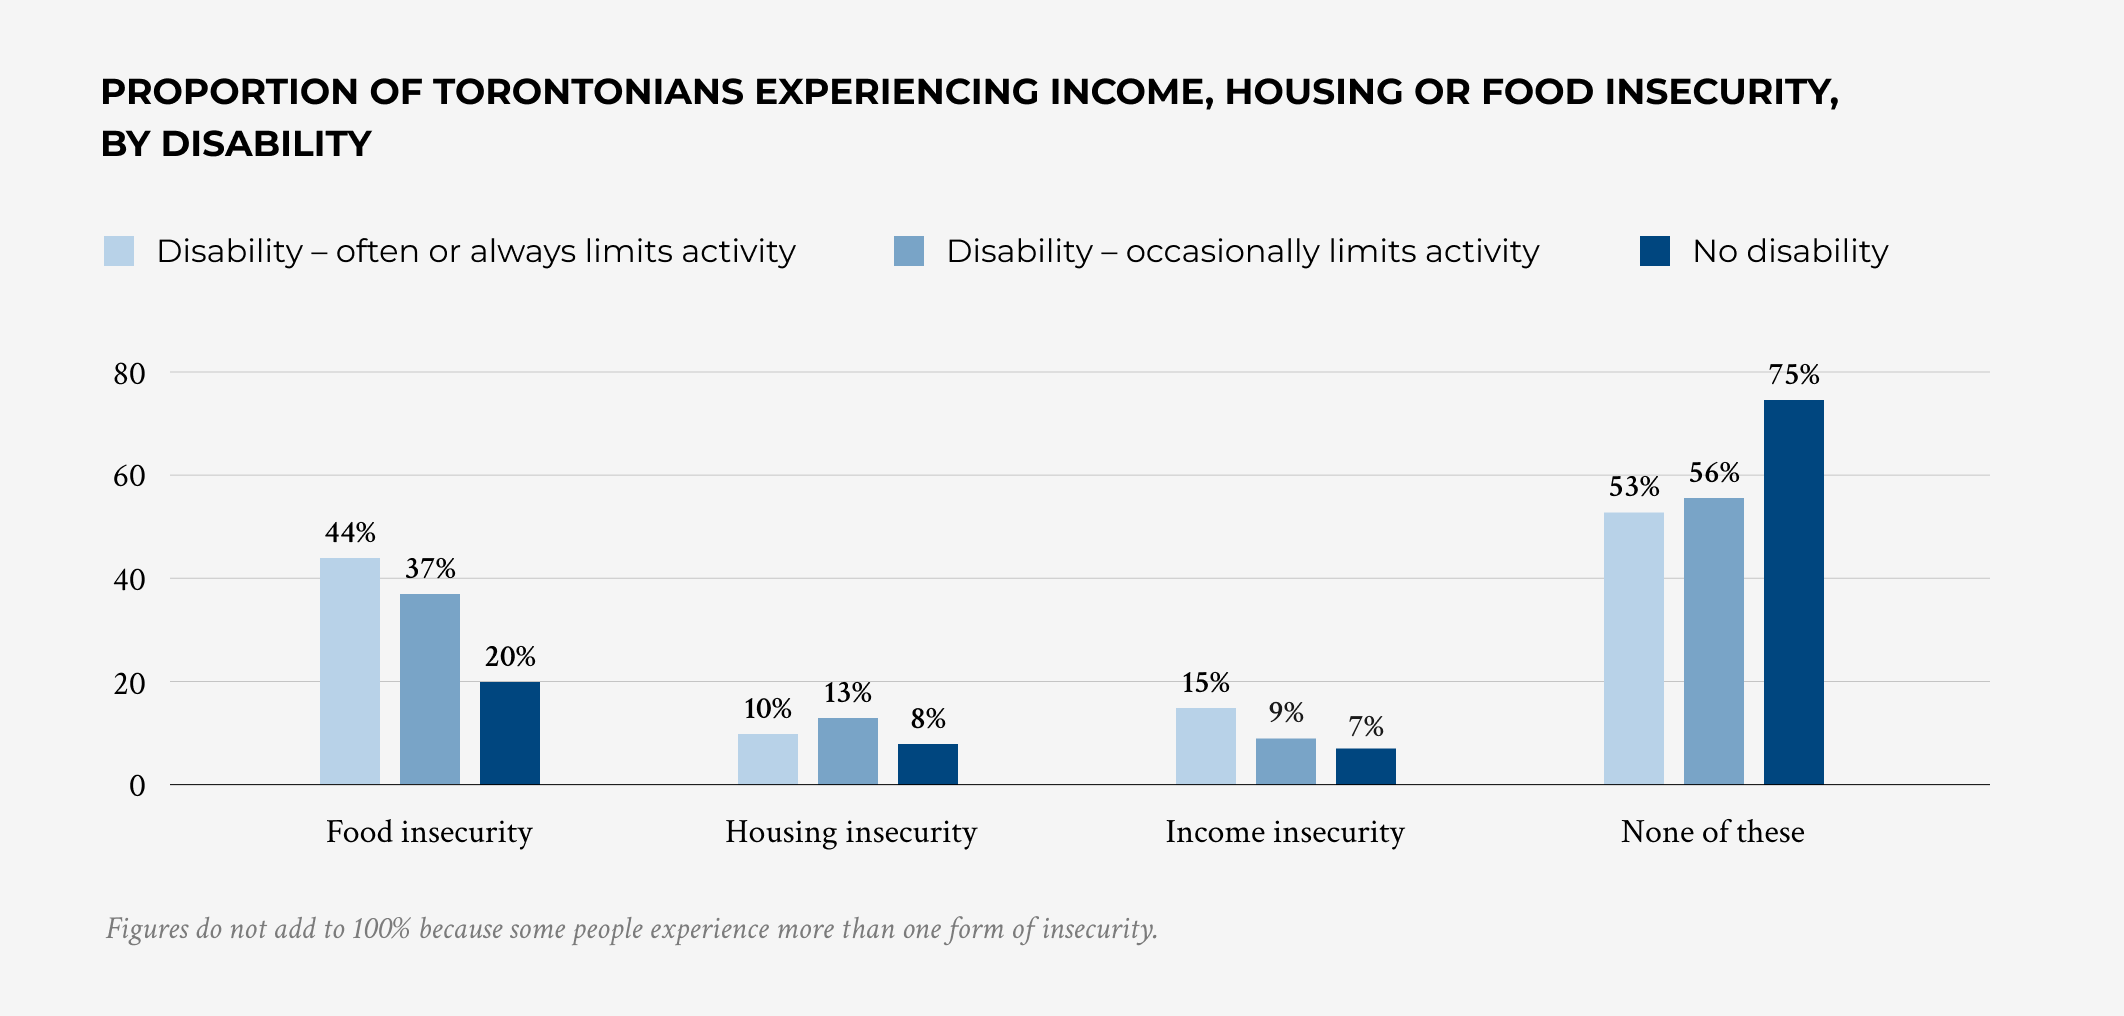
Torontonians with a disability are more likely to face economic insecurity.
- Three in four Torontonians without a disability (75%) face none of the three forms of economic insecurity.
- By contrast, only 53% of those with a disability that often or always limits their daily activity, and 56% of those with a disability that occasionally limits their daily activity, face none of the three forms of economic insecurity.
Torontonians are slightly more likely than the national average to report experiencing at least one of the three forms of economic insecurity.
- The Social Capital in Canada 2026 survey allows rates of economic insecurity in Toronto to be compared to those nation-wide.
- Nation-wide, 73% of adult Canadians do not experience any of the three forms of economic insecurity, a slightly higher proportion than in the City of Toronto (67%).
Definitions
Income insecurity is defined as city residents who describe their current total household income as not enough for them and that they are having a hard time.
Housing insecurity is defined as city residents who report always having difficulty coming up with enough money to pay their rent or mortgage each month.
Food insecurity is defined as city residents who report eating less than they feel they should at some point during the previous 12 months because there was not enough money to buy food.
Note that these are three separate measures that each have their own thresholds and time period references (i.e., currently versus in at any time in the past 12 months).
Data Table
See more results in the complete survey data tables here.
Numbers may not add to exactly 100% due to rounding.